Forum Replies Created
-
AuthorPosts
-
 Hugh AllenParticipant
Robin,
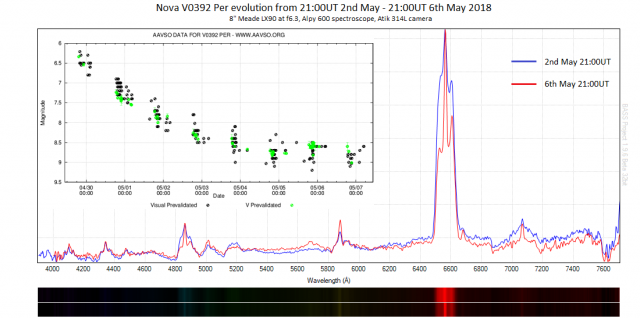
I’m not sure of the best way to compare my two relative intensity spectra but here’s what I did for my spectra from 2nd and 6th May…
Cheers
Hugh
 Hugh AllenParticipant
Amazing spectrum Michael. Is there a classification system of meteor spectra?
Cheers
Hugh
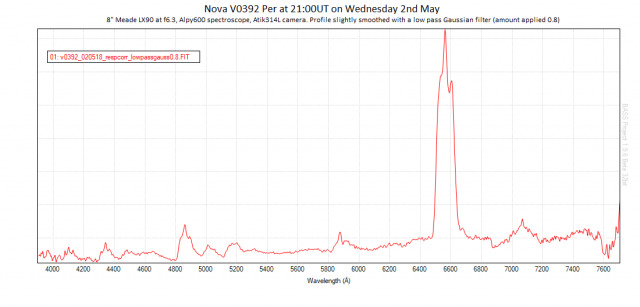
Hugh AllenParticipantNova V0392 Per on Wednesday evening 2nd May. Just had a chance to process my rather low quality spectrum taken under difficult conditions. Anyway, the hugely doppler-broadened hydrogen and helium emissions are very clear especially of course the towering Hα emission. A central, narrow peak at the normal rest wavelength is emerging from each broadened emission. This narrow peak seems to be becoming more pronounced in the most recent spectra on the ARAS forum http://spectro-aras.com/forum/viewtopic.php…
 Hugh AllenParticipant
Hi Gary,
I couldn’t see an attachment?
Hugh AllenParticipantHi Ian,
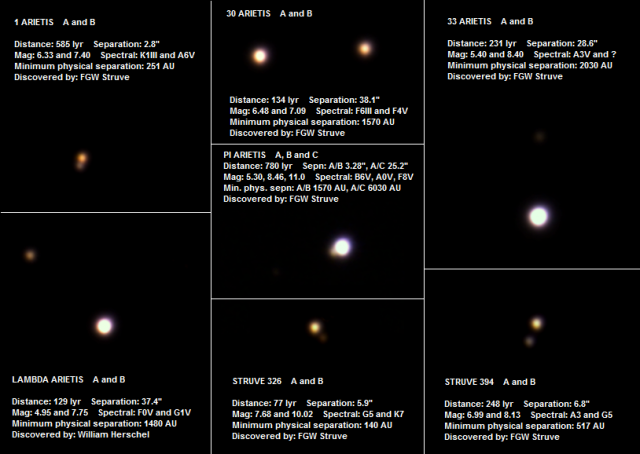
I think double stars are a wonderful way to access observational astronomy and great fun as you say to think about and research. I’m sure you could master your 5″ refractor by focusing on the bright double stars (there are many) and then you’d be hooked. When conditions are less than ideal there are always beautiful double stars to fall back on and they can make great targets for little projects that help keep you engaged in this wonderful hobby. For example, a few years ago I decided to explore and image some of the double stars in Aries, my birth constellation. This was the result and it was great fun! Good luck 🙂
Hugh
 Hugh AllenParticipant
Hi John,
Nice spectra. It’s interesting to see a DSLR being used with the Alpy. I think it’s important to remember that the expression of spectral lines is strongly determined by the environment. Absence of lines doesn’t necessarily imply absence of the chemical element. And conversely, presence of strong lines doesn’t necessarily mean a high concentration of the element. The iron in the disc around psi Per won’t I don’t think have been dredged up from the core, it will have been present in the nebula in which the star was originally formed. The Sun shows strong iron absorption lines, and exceedingly strong calcium lines, much stronger than the hydrogen absorption lines even though hydrogen atoms vastly outnumber calcium and iron in the Sun’s composition
Cheers
Hugh
Hugh AllenParticipantHi again David,
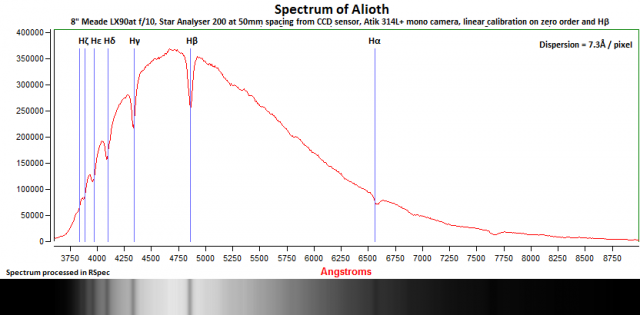
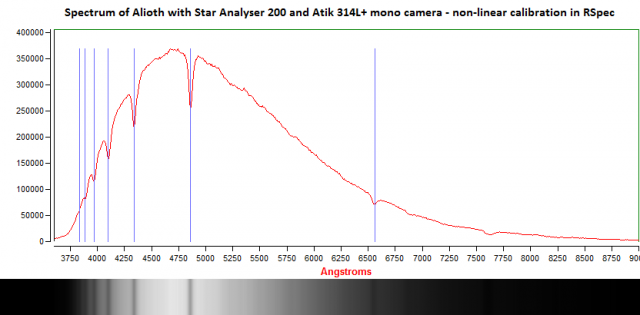
As Andrew said, that’s a nice first spectrum. And isn’t it great that spectroscopy can be done through cloud, moonlight and light pollution! Alioth is a normal A-type giant star so the Balmer absorption lines are strong and still reasonably broad, perfect for the Star Analyser. The shallow absorption lines in your profile could be because of focus, or I suspect maybe also overexposure? The pixel map option in RSpec gives a nice way of evaluating the exposure of each pixel – if you look at the pixels around the peak brightness in your profile (near 4500Å) the brightest pixels should be no more than 80-85% of the peak ADU from your camera (so 80-85% of 65,536 if you’re using a 16-bit camera). Once you’re happy with exposure and focus so that you’re getting nice deep absorption lines I’d recommend a non-linear calibration in RSpec. The spectrum from the Star Analyser is surprisingly non-linear; here’s a comparison I made of the spectrum of Alioth (like your spectrum, not yet response corrected) with linear and non-linear calibration in RSpec.
Cheers
Hugh
 Hugh AllenParticipant
Hi David,
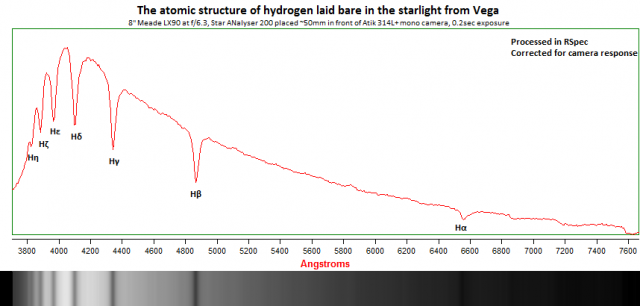
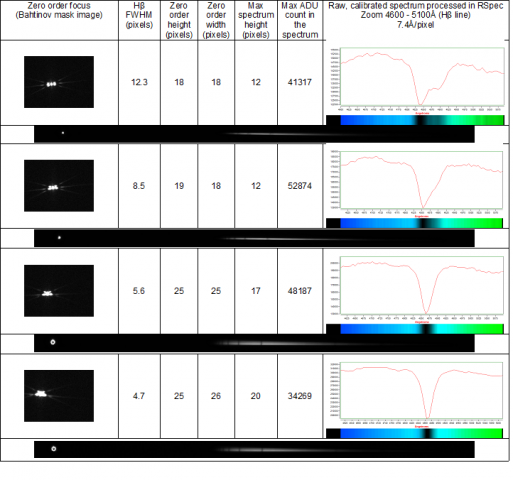
Congratulations on taking the plunge, I am sure you’ll really enjoy spectroscopy. I think a spectroscope is a wonderful observing tool but many starters seem to fall by the way side. I’d echo the advice to stay initially on bright targets, ideally A- and B-type main sequence stars that have strong Balmer absorption lines. This will allow you easily to see when things are not working so that you can quickly develop understanding of spectrum image capture and processing without losing heart. I think a key thing to learn is good focusing of the spectrum. Here’s a study I did on Vega with my Star Analyser 200 to find the optimum focus point for the sharpest spectrum (narrowest, deepest absorption line). It is not perfect focus on the star itself but slightly backed off. The Bahtinov mask focus image shows that very clearly. When I use my Star Analyser I begin each session by setting the focus on a bright A-type star. Good luck and of course feel free to ask any questions
Cheers
Hugh
 Hugh AllenParticipant
Hi Kate,
It is strange that the two brightest stars gave the ‘noisiest’ spectra. And also strange that you got a good spectrum of beta Peg in between the two noisy ones so presumably the problem wasn’t due to some step change in the set-up. All but beta Peg are hot B-type stars so again, no correlation there either. Maybe there was patchy cloud on the night which reduced the light from the two noisy stars? The fact that you obtained good quality spectra from two of the stars, event the faintest, suggests that fundamentally all is well with your set-up
Cheers
Hugh
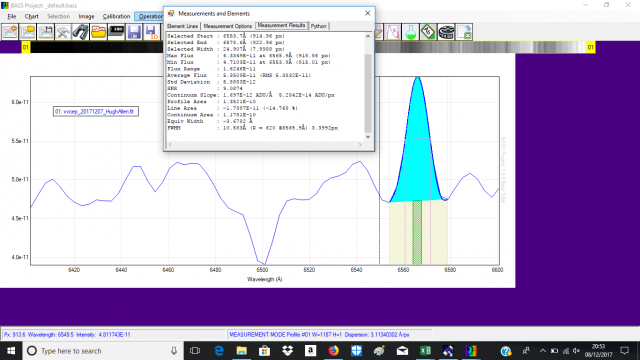
Hugh AllenParticipantI used a crude but simple estimate of the EW of the Hα and Hβ emission lines in the VV Cep spectrum, in order to monitor progress of the current eclipse. I drew a ‘continuum’ by extending a straight line between the turning points at the base of the emission lines. As an example here’s the result I got in BASS with last night’s spectrum:
I realise the approach is not strictly scientific but is repeatable and seems to have given a reasonably comparable set of measurements. Here’s the latest time plot of my EW measurements on my own and others’ Alpy spectra:

The latest episode of Hα brightening seems to have appeared bang on time!
I’d welcome any comments on the approach
Cheers
Hugh
Hugh AllenParticipantHi Robin,
How tall a background subtraction region would you select in such situations of higher relative light pollution?
Cheers
Hugh
Hugh AllenParticipant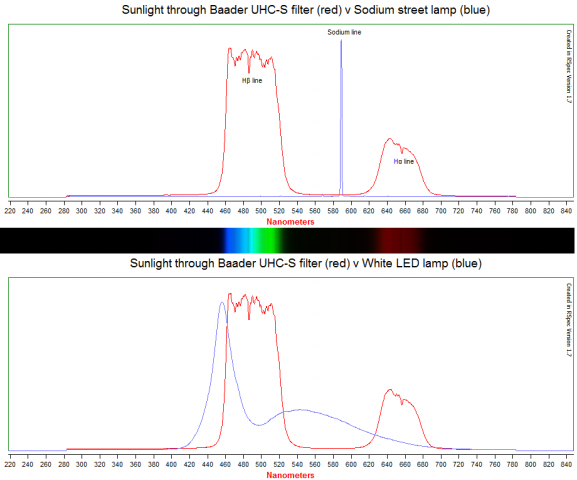 Hi Jack,
Some time ago I used spectroscopy to illustrate the dangers posed by light pollution from white LEDs for astrophotography. My attachment shows how sunlight is filtered by a light pollution filter like the Baader UHC-S filter, to show what wavelengths are let through by the filter. The narrow emission from sodium is of course blocked by the filter whilst the broader emission from a white LED will leak through. However as Paul says background subtraction in spectroscopy would effectively remove light pollution at the risk presumably of introducing more noise. None of the spectra are response corrected
Cheers
Hugh
Hugh AllenParticipantThanks Robin, that;s very interesting and not something I had thought about before. I can see in BASS the filtering option under the ‘Resample Profile’ tab which offers a couple of options, ‘low pass’ and ‘low pass Gaussian’. The Gaussian option looks to deliver the better filtered profile in comparison to my Star Analyser spectra.
Much appreciated
Hugh
Hugh AllenParticipantHi again Peter,
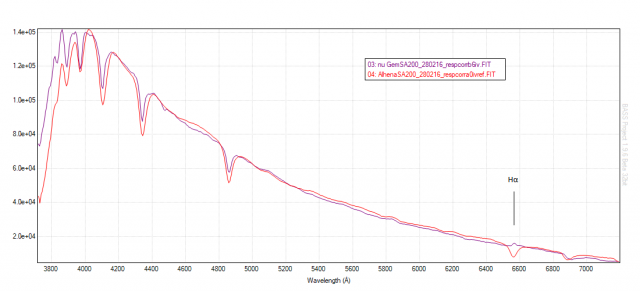
Once you feel you’ve mastered the processing of your spectra following Robin’s guidance, there is a nice little project you could try. In the same area of sky as Alhena there is a bright 4th magnitude Be star called nu Gem (Hα line in emission instead of absorption). Overlaying the spectra of Alhena and nu Gem clearly shows the difference in the Hα line between the two stars….
 Hugh AllenParticipant
Hi Robin,
Could you explain a bit more about the process of filtering the reference spectrum so that the resolution more closely matches the measured spectrum?
Cheers
Hugh
Hugh AllenParticipantHi Peter,
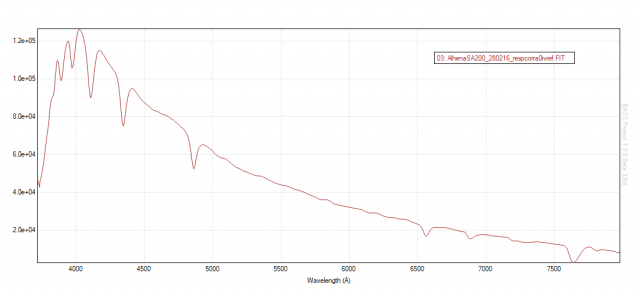
I also captured the spectrum of Alhena with a Star Analyser (SA200 in my case). My result is attached and is in pretty good agreement with your own. I wonder if you should also have a play with the focus to see if you could capture one or two more of the Balmer lines at shorter wavelength? I use an Atik 314L camera and I process the images in BASS. I like the BASS alignment function for stacking the images, it seems to do a good job on aligning the Star Analyser images when the star can shift slightly in position from one image to another. Anyway I think your results are looking very promising
Cheers
Hugh
 Hugh AllenParticipant
Thanks David, that’s a very interesting set of data that you have generated on AX Per. It prompted me to think about the timing of the EG And eclipse.
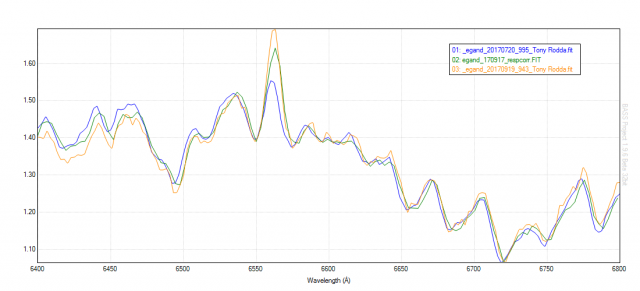
The most recent paper that I could find relating to this was a PhD thesis from 2012 by Joseph Roche at the University of Dublin https://arxiv.org/abs/1210.7699 Based on the table of observations on page 72, especially the observation at phase 0.497 on 31st July 2003, I estimate that the last AG And eclipse occurred around mid-June this year (using the orbital period of 482.6 days from Fekel et al in 2000 http://iopscience.iop.org/article/10.1086/301260/pdf). This fits well with Tony’s spectrum on 20th July 2017 where the Hα emission is just beginning to exceed the adjacent continuum peak at about 6534Å, indicating that the white dwarf is beginning to re-emerge from behind the red giant. It also fits well with J Guarro Flo’s series of spectra from 21st Jan – 24th Feb last year 2016 which show the lowest Hα emission relative to the 6534Å continuum occurring somewhere near 30th Jan 2016 (I estimate that the eclipse would have occurred around mid Feb 2016). The next AG And eclipse should therefore be in early October next year 2018, nicely timed for a regular series of observations at a scociable evening hour in the months surrounding 🙂
Cheers
Hugh
Hugh AllenParticipantHi Tony,
Very nice spectra as ever, the emission lines in AX Per are amazingly intense! I noticed from the EG And spectra that we’re both posting in the database that the H-alpha emission is brightening significantly. I downloaded your July 20th and September 19th spectra and added in my September 17th spectrum. There is a nice brightening trend even between 17th and 19th! The database is a great resource. Good luck with your new observatory
Cheers
Hugh
 Hugh AllenParticipant
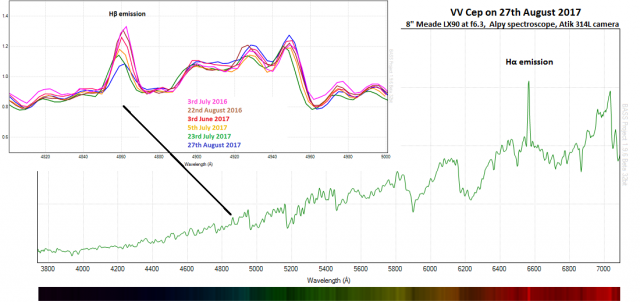
Great spectra Steve, are you adding the VV Cep to the BAA database? I captured a spectrum just the night before on the 27th August. I have seen a significant decline in the Balmer emissions since I began to take spectra last year….
 Hugh AllenParticipant
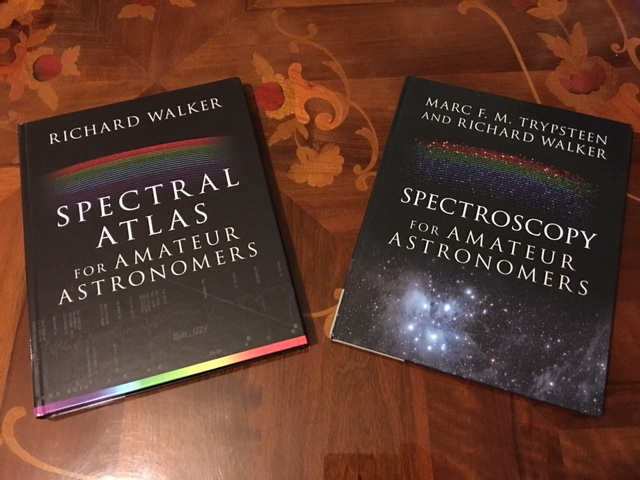
My copies arrived a couple of days ago. The spectra in the Atlas are beautifully reproduced. Thank you both!
Hugh
-
AuthorPosts