Forum Replies Created
-
AuthorPosts
-
 Robin LeadbeaterParticipant
Congratulations Andy !
Robin LeadbeaterParticipantA series of spectra by Peter Velez
https://www.spectro-aras.com/forum/viewtopic.php?t=3150Cheers
RobinRobin LeadbeaterParticipantThere is an interesting little “Muon Telescope” project here using 4 Geiger detectors in a coincidence detecting array
http://parac.eu/projectmk30.htmCheers
RobinRobin LeadbeaterParticipantBe interesting if there are spectra from around the same to see what’s happening there
The spectra in the ARAS database
https://aras-database.github.io/database/novavul2024.html
seem to suggest an overall drop in both continuum and H alpha from 20240828-20240907 with H alpha increasing slightly relative to the continuumCheers
RobinRobin LeadbeaterParticipantIf the spectra are too weak for ISIS to lock on to but overlay each other well in the combined image, you can just leave the fixed Y coordinate position box ticked. (My guiding takes care of the movement in Y so I normally operate this way)
Cheers
Robin-
This reply was modified 1 year, 10 months ago by
 Robin Leadbeater.
Robin LeadbeaterParticipantIf you try ticking the fixed Y coordinate and sky not removed boxes and rerun the calibration, then click “display image” in the go tab, you will get the sum of your spectrum images with the binning zones overlaid so you can see what is happening. The objective is to have the spectra overlaying each other with the region
with the combined spectrum as narrow as possible. The spectrum binning zone should include all the spectrum region and the sky zones should include none of the spectrum region. If the spectra are not in the same Y position, with the fixed Y coordinate box unticked ISIS will attempt to track the Y movement and overlay them but as David says it may not lock onto faint spectra or with large movements between spectra.Cheers
Robin-
This reply was modified 1 year, 10 months ago by Robin Leadbeater.
Robin LeadbeaterParticipantThanks David
I’m in !
Cheers
RobinRobin LeadbeaterParticipantHi Stan,
The flare and time stamp on the image file name should be correct within a few seconds (2024-08-12 23:27:40 UTC) What time was your fireball ?
The camera takes 10 sec exposures per frame for fainter objects in the deeper sky rather than video for meteors but I am pretty sure what I saw was a satellite, not a fireball.
In the stretched images I can see the faint track for about 50 seconds before the flare, the flare lasted about 20 seconds and the track then continued as before the flare for at least another 10 seconds.
The animation is too big to post here but I have uploaded it to my website here.
http://threehillsobservatory.co.uk/allsky_camera/sat_flare_202408012T23_27_40_stretched.gif
The animation is 20x true speed. Each frame is a 10 second exposure, the yellow arrow marks the track in each image.Did any of the myriad of NEMATODE/GMN cameras in the south of the country pick up your fireball perhaps?
Cheers
Robin-
This reply was modified 1 year, 11 months ago by Robin Leadbeater.
-
This reply was modified 1 year, 11 months ago by Robin Leadbeater.
Robin LeadbeaterParticipantHi Alex,
This camera is running with 10 sec exposures but building it has piqued my interest in perhaps building a GMN meteor camera so I might be in touch 🙂
Cheers
Robin-
This reply was modified 1 year, 11 months ago by Robin Leadbeater.
Robin LeadbeaterParticipantWhile testing my new all sky camera last night, some nice displays on the overnight time lapse (sadly not colour though)
http://www.threehillsobservatory.co.uk/allsky_camera/allsky_camera_page.htmCheers
RobinRobin LeadbeaterParticipantCaught a ridiculously bright satellite glint in the all sky camera last night, straddling two 10 sec exposures. (At first I thought is was a meteor but the faint track can be followed across the sky in the stretched images)
Attachments:
Robin LeadbeaterParticipantIt is probably still useable, with a dab of black paint over the scratch or just avoid putting the spectrum in that region.
Slits wider than the normal seeing are good for extended objects (eg comets nebulae etc) allowing more signal to be collected and for absolute flux measurements ensuring all the flux is collected (both with a reduction in resolution of course)
Cheers
Robin3 August 2024 at 6:21 pm in reply to: Need help with instrumental response for low-res spectroscopy #624076Robin LeadbeaterParticipantSo how do you handle the blue end with the LHIRES then?
I don’t have a solution so run without a flat, making sure I put the reference star in the same position along the slit and try to include any flat effects in the response. (I don’t use the LHIRES at low resolution and 90% of the time I am working at the red end so it is not a problem there)
I have not investigated it fully but it may be mainly light from the built in lamp leaking round the slit holder. Running a flat lamp ahead of the telescope aperture might be a better solution as the beam will be more tightly controlled. The calibration setup in the LHIRES is rather crude with the lamps just swung in over the slit. The setup in the ALPY calibrator is much better designed.
3 August 2024 at 6:10 pm in reply to: Need help with instrumental response for low-res spectroscopy #624074Robin LeadbeaterParticipantWhen selecting the binning region for a spectrum, I stretch the image to make the full top and bottom edges of the spectrum visible. I then set the edge of the spectrum bin to include all of the signal, even the weak parts, while trying not to include any unnecessary background.
Yes this can be particularly important if there is any chromatism or atmospheric dispersion which will change the width of the spectrum along the wavelength axis (or any residual tilt) so the fraction sampled varies. (ISIS has an optimal binning option which seems to cope with this while minimising the sky contribution. It is rather effective on faint targets, though I am not exactly sure how it does it). Similarly the sky background zones need to be set far enough away not to include any of the spectrum. Stretching also helps spot any weak spectra which might be in the selected sky background zones, a bigger problem with slitless setups.
Cheers
Robin-
This reply was modified 1 year, 11 months ago by Robin Leadbeater.
Robin LeadbeaterParticipantAha ! got it. Not random then.
Thanks
RobinRobin LeadbeaterParticipantCheck for a scratch in the mirror slit coating
If it is that, you should see it in the guider image
Cheers
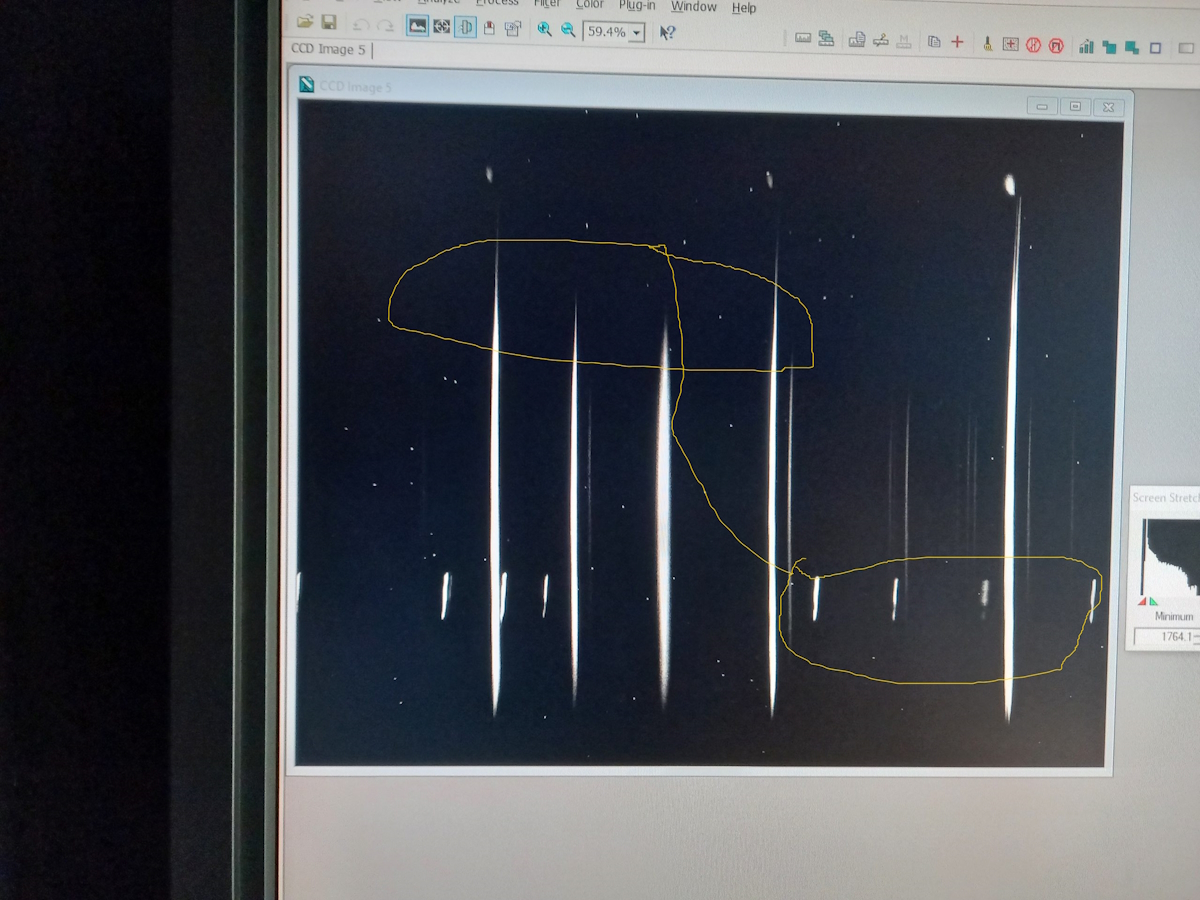
RobinRobin LeadbeaterParticipantThe additional short spectrum lines are an offset image of the main spectrum. Check for a scratch in the mirror slit coating
Cheers
Robin-
This reply was modified 1 year, 11 months ago by Robin Leadbeater. Reason: annotated image added
-
This reply was modified 1 year, 11 months ago by Robin Leadbeater.
Attachments:
3 August 2024 at 3:50 pm in reply to: Need help with instrumental response for low-res spectroscopy #624060Robin LeadbeaterParticipant” why and how does reddening matter? OK, the actual spectrum does not match what we would expect – but as long as it is consistent as it is, could that not sufficient for a good ref-star? ”
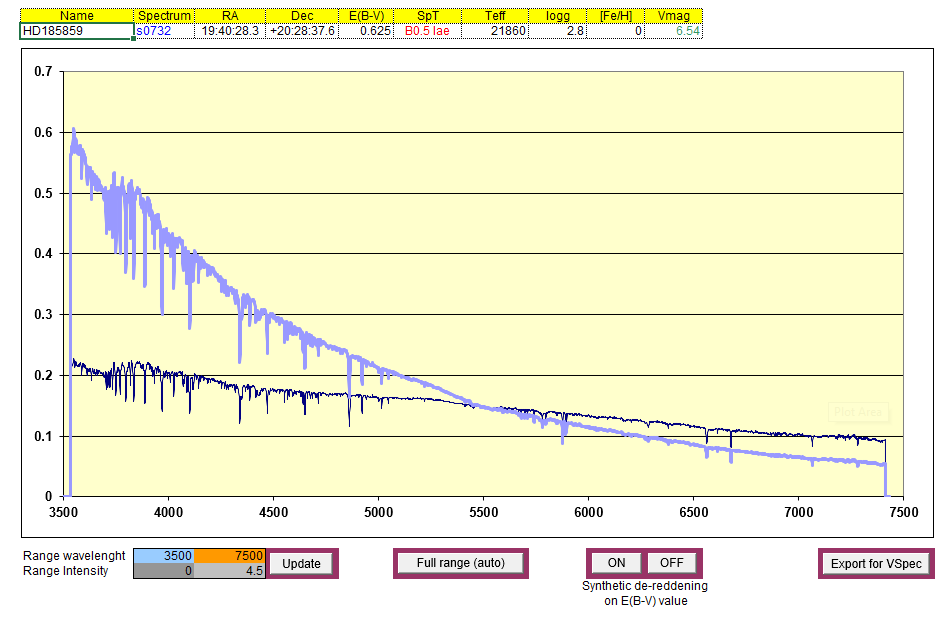
If the spectrum is reliable then yes, reddening should not matter as you have shown here. 0.6 reddening is a lot though (~80% of the light in the V band is being absorbed) and I prefer my reference stars to be as “normal” as possible. If the (B-V) matches that expected for the spectral class as it should do for a star without IS extinction that gives added confidence that all is well. (Reddening of course matters and needs to be low if we are assuming a spectral type and using the Pickles spectrum)
” I use a camera with relatively low dynamic range (8 bits)”
8 bits is not really enough for serious work but are you sure your camera is only 8 bits? the ASI183MM spec says it can run at 12 bits (often stretched to appear as 16 bits in fits images by the software.)
https://www.zwoastro.com/product/asi183/I don’t have much experience of CMOS cameras but as a starting point I would suggest setting the gain so you use the full 15k well depth, expose so the maximum is around 2/3 of saturation and average many flats (eg 20-30) to beat down the noise at the blue end, not forgetting to subtract bias and dark when [preparing the master flat (The ISIS “masters” tab handles this)
The other thing to watch out with flats is stray light in the spectrograph. I don’t know what the LowSpec is like but with the LHIRES, flats at the blue end are unusable as most of the light comes from stray light, not from the spectrum !
-
This reply was modified 1 year, 11 months ago by Robin Leadbeater.
-
This reply was modified 1 year, 11 months ago by Robin Leadbeater.
3 August 2024 at 1:44 pm in reply to: Need help with instrumental response for low-res spectroscopy #624055Robin LeadbeaterParticipantPerhaps more significantly though is that in this case it confirms that the MILES spectrum of HD185859 appears to be ok, despite it being a blue hypergiant emission line star (B0.5 Iae) with a very high IS extinction of E(B-V) = 0.6 (I have to say it would not have been my first choice as a reference star !)
-
This reply was modified 1 year, 11 months ago by Robin Leadbeater.
Attachments:
3 August 2024 at 11:26 am in reply to: Need help with instrumental response for low-res spectroscopy #624049Robin LeadbeaterParticipantExcellent ! The matching width and strength of the Balmer lines in your HD187362 spectrum with the Pickles reference confirms the spectral classification (I used A2v but the difference between A2v and A3v is <5%, perhaps A2.5V would be the closest match) and the matching continuum shape tells us that there is little or no interstellar extinction. We can now also confidently use HD187362 as a reference star
-
This reply was modified 1 year, 11 months ago by Robin Leadbeater.
-
This reply was modified 1 year, 11 months ago by Robin Leadbeater. Reason: added more info on spectral classification
-
This reply was modified 1 year, 10 months ago by
-
AuthorPosts

