Forum Replies Created
-
AuthorPosts
-
 Robin LeadbeaterParticipant
Like the comment there about it being green so it must be space junk as the guy who told him has a PhD in physics so must be right !
Here are the details based on UKMON cameras
Cheers
Robin13 November 2024 at 12:12 pm in reply to: SUNSCAN – A fully integrated “Smart Spectroheliograph” #626425Robin LeadbeaterParticipantThe details of this device are yet to be revealed though
Now officially launched.
https://www.sunscan.net/Cheers
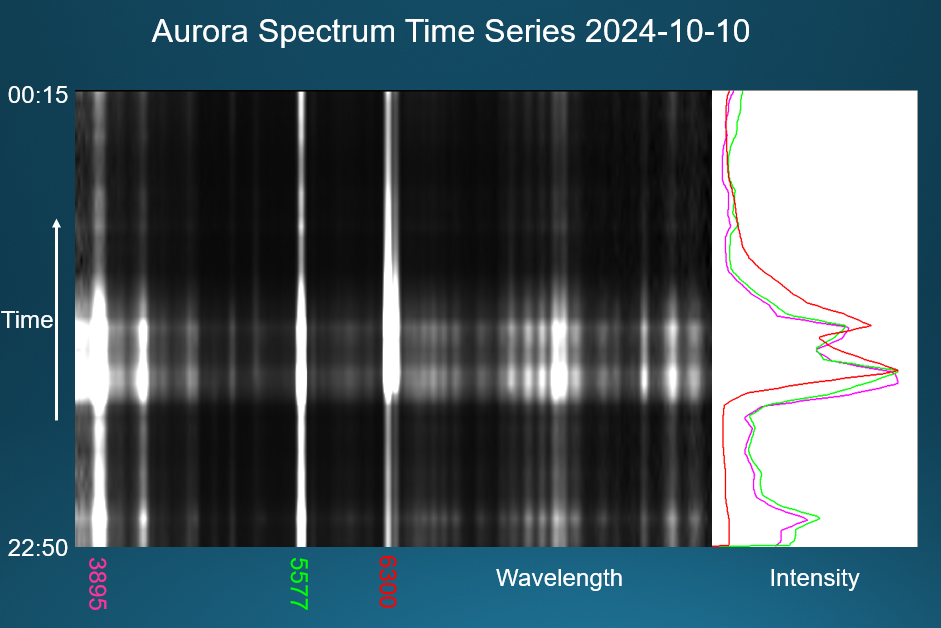
RobinRobin LeadbeaterParticipantHere is the spectrum time series as a 2D greyscale plot with the intensities of three line extracted (qualitative only, no flux calibration)
I was surprised to find that it was only last year that hyperspectral techniques had first been applied to aurora
https://phys.org/news/2024-08-full-d-spectral-image-aurora.htmlCheers
Robin-
This reply was modified 1 year, 8 months ago by
 Robin Leadbeater.
Attachments:
9 November 2024 at 11:50 pm in reply to: GOTO065054.49+593624.51: Discovery of a bright optical galactic transient #626375Robin LeadbeaterParticipantJust had a heads up from Tom Killestein. It’s bounced again. mag 15, up from 17.4 this morning
Robin
Robin LeadbeaterParticipantnote the default setting only gives the location in deg,min,sec to one second resolution. If you need higher resolution switch to decimal degrees (tools ,settings, formats and units, lat lon format, decimal) this then give the location in degrees to 6 decimal places (less than a metre)
EDIT, looking at some papers on this the actual absolute accuracy though is probably more like 5-10m in position and a couple of metres in elevation
Cheers
Robin-
This reply was modified 1 year, 8 months ago by Robin Leadbeater.
-
This reply was modified 1 year, 8 months ago by Robin Leadbeater.
Robin LeadbeaterParticipantHi Jack,
I recently had to do this for a meteor camera installation, needed to a couple of metres accuracy. The recommendation was Google Earth
https://earth.google.com/
Zoom into your exact location, right click and click info in the pop up boxCheers
RobinRobin LeadbeaterParticipantA spectrum time series showing the variation in the various emission lines during this event
Cheers
RobinRobin LeadbeaterParticipantHere’s the Celestron version.
https://www.celestron.com/cdn/shop/products/93665_NexStar_Wedge_6_570x380@2x.jpg?v=1590984227
Looks like a heck of a bending moment on the arm thoughRobin LeadbeaterParticipantOr fit a field rotator before the camera
Or a wedge provided the software recognises this equatorial mode
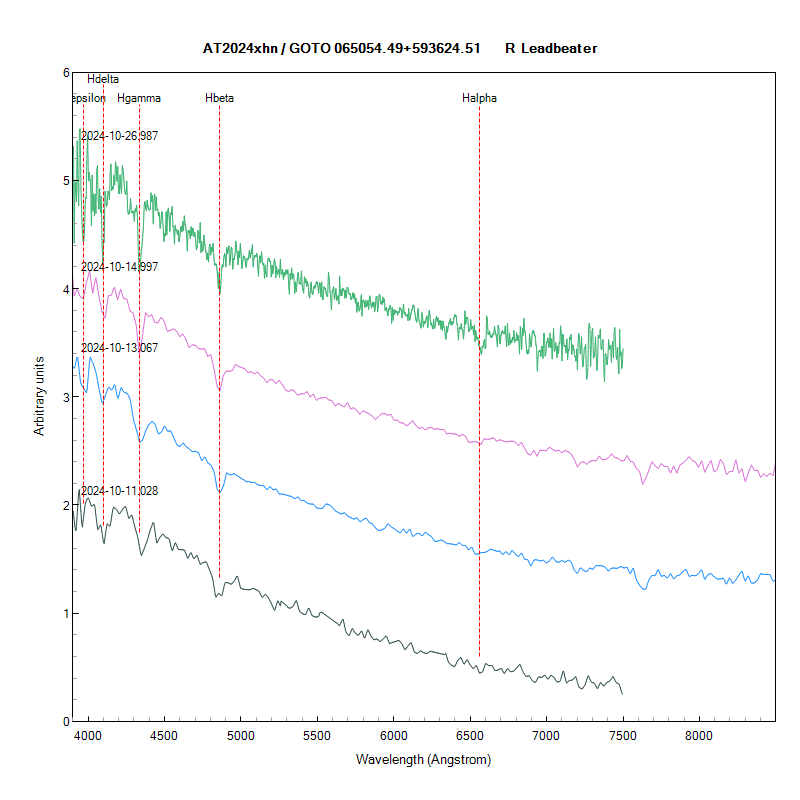
28 October 2024 at 8:05 pm in reply to: GOTO065054.49+593624.51: Discovery of a bright optical galactic transient #626107Robin LeadbeaterParticipantA few more spectra, the latest one at higher resolution with the ALPY600 (missed the fade unfortunately)
Cheers
RobinAttachments:
Robin LeadbeaterParticipantGreat capture Bill.
Things have certainly moved on from my one (and only) attempt at this nearly 20 years ago
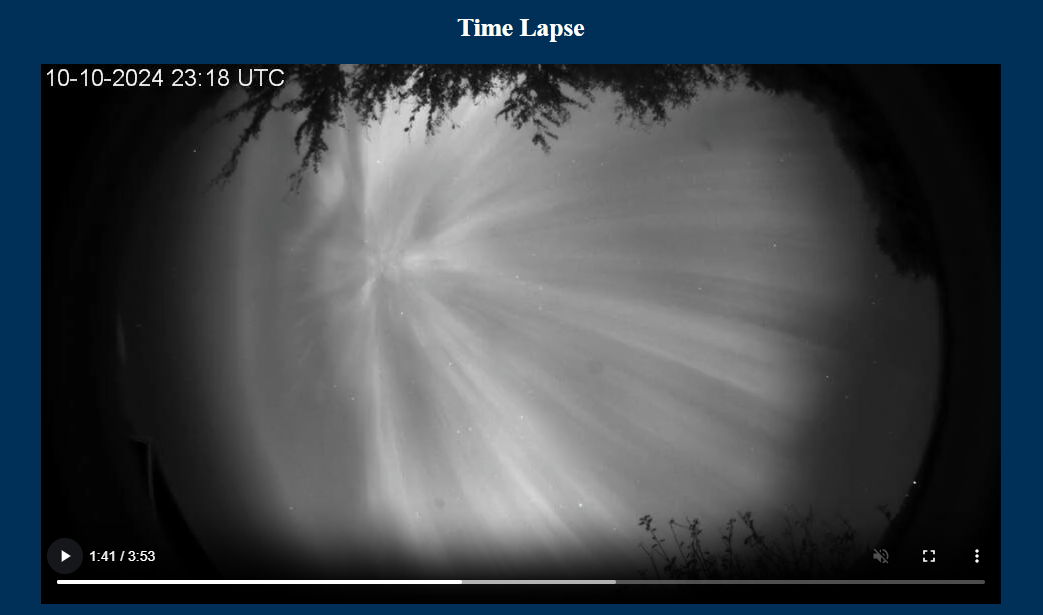
http://www.threehillsobservatory.co.uk/astro/spectra_20.htmRobin LeadbeaterParticipantIt is interesting to try to compare Nick’s time lapse with what was seen at the same time from 400km further north, now archived at
http://threehillsobservatory.co.uk/allsky_camera/allsky_20241010_aurora.mp4
(South is to the left, west is up)
The short intense burst at ~21:02 corresponds to a bright band briefly appearing to the south in my camera and the other intense period ~23:15-23:35 coincides with when it shifted from north to overhead and south hereCheers
RobinRobin LeadbeaterParticipantThe weakness of the Swan band emission does confirm earlier observations that it is a carbon depleted comet eg
https://www.astronomerstelegram.org/?read=16637Cheers
Robin-
This reply was modified 1 year, 9 months ago by Robin Leadbeater.
Robin LeadbeaterParticipantHi David,
What was the orientation of the slit relative to the comet? The sodium emission line is seen only on one side of the coma so presumably is from the sodium tail rather than any light pollution/atmospheric emission line
Cheers
RobinRobin LeadbeaterParticipantIf you zoom in you will find Comet 13P/Olbers
I had noticed that conjunction in CdC and wondered if anyone would get them in the same frame. Impressive image !
Robin
Robin LeadbeaterParticipantBe careful if using MELCHIORS spectra. I have studied a few and found two suspect spectra already so there may be more
HD205021B is the wrong star
HD180482 (22 Aql) has the wrong continuum shape
See
https://www.spectro-aras.com/forum/viewtopic.php?t=3148Cheers
RobinRobin LeadbeaterParticipantOh Dear, I see BBC Lead Weather Presenter Simon King is suggesting looking for the comet tonight “Around Sunset at 18:00-18:30 BST”.
https://www.bbc.co.uk/weather/articles/cq5e6jne670o
There is going to be a lot of disappointed people giving up at 18:30 when they could have had a nice view an hour later! There is a Twitter (x) link but I don’t use that. Anyone care to put him straight on this?Cheers
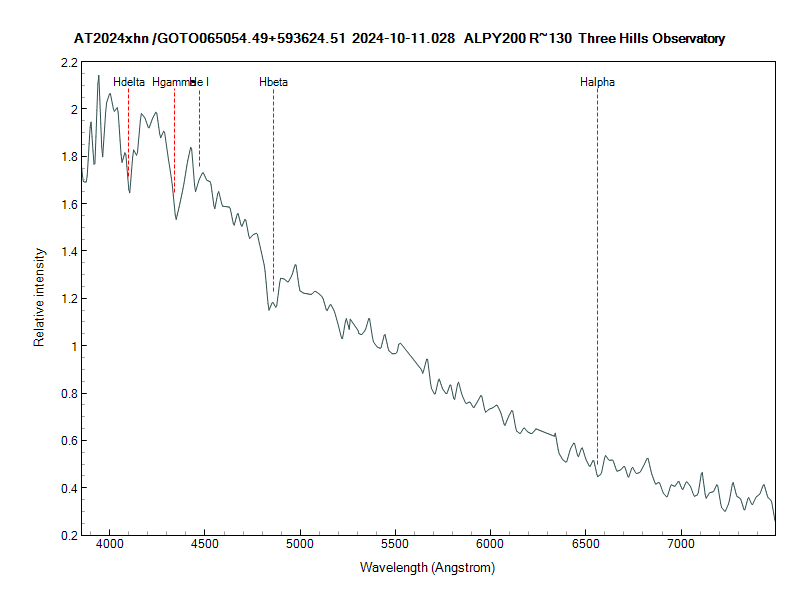
Robin12 October 2024 at 5:56 pm in reply to: GOTO065054.49+593624.51: Discovery of a bright optical galactic transient #625746Robin LeadbeaterParticipantAn ALPY200 spectrum from 20241010 (with severe auroral line contamination removed) confirms the typical features of a dwarf nova in outburst as described in ATel 16858
Cheers
RobinAttachments:
Robin LeadbeaterParticipantClear here most of the night and spectacularly dynamic, particularly for about an hour around 23:00 UT. Captured on the all sky camera where the image to the north was saturated most of the time
http://www.threehillsobservatory.co.uk/allsky_camera/allsky_camera_page.htm
here is a single frame teaserCheers
RobinAttachments:
11 October 2024 at 3:31 am in reply to: SUNSCAN – A fully integrated “Smart Spectroheliograph” #625645Robin LeadbeaterParticipantYou can do it with a fixed mount using the natural sidereal motion to drift the sun across the slit as I experimented with here with my LHIRES
http://www.threehillsobservatory.co.uk/astro/spectra_29.htm
With Buil’s other instrument the SolEx, it is essentially a high resolution spectrograph which is mounted on a telescope and the mount is normally driven at x times sidereal, taking advantage of improvements in camera sensitivity and speed to reduce the scan time so the result is less reliant on stable conditions. The details of this device are yet to be revealed though-
This reply was modified 1 year, 9 months ago by Robin Leadbeater.
-
This reply was modified 1 year, 9 months ago by Robin Leadbeater.
-
This reply was modified 1 year, 8 months ago by
-
AuthorPosts