Forum Replies Created
-
AuthorPosts
-
 David BoydParticipant
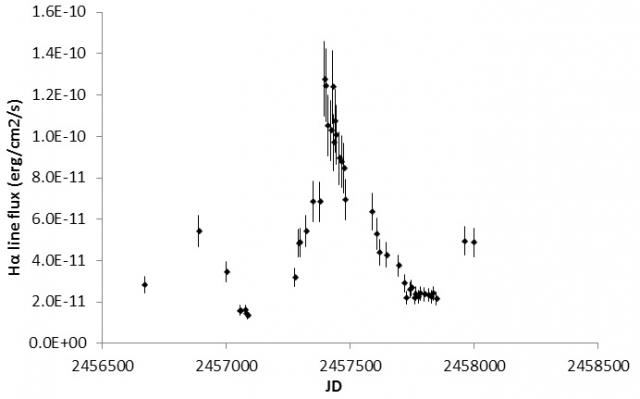
It is also worth keeping an eye on the H-alpha emission line in AX Per which shows strong orbital modulation, as do all the Balmer lines. The following plot shows my flux measurements over the last two orbital cycles. Coverage of the first cycle was patchy. The phase is currently about 0.4 and the flux is now rising. It will be interesting to see if the peak is as high as last cycle.
Regards,
David
 3 August 2017 at 4:33 pm in reply to: Keeler’s seminal paper on the spectroscopic observation of nebulae #578423David BoydParticipant
Robin,
Thanks for the reference to Huggins’ publication. His description of his equipment and his early visual spectroscopic observations is fascinating. His efforts to reliably calibrate his spectra are positively heroic. You get a real sense of his excitement in discovering the nature of the objects he was observing spectroscopically for the first time. He was one of the first to attempt to classify spectra in a systematic way. You can also sense his competitiveness in promoting his discoveries. It’s a great read.
David
26 July 2017 at 9:46 am in reply to: Measuring radial velocity of planetary nebulae with Alpy? #578370David BoydParticipantHi Paul,
Have you tried measuring some RV standard stars to calibrate your capability? The Soubiran et al catalogue prepared for Gaia gives a good list – https://www.aanda.org/articles/aa/abs/2013/04/aa20927-12/aa20927-12.html.
These are 6th to 10th mag stars and there are several dozen with RVs greater than 50km/s, both +ve and -ve. They are F, G and K type stars so good for using in cross-correlation. About 20% of them have southern Decs down to -10deg. This would let you see what consistency you can expect.
David
David BoydParticipantI sent the spectrum to Elena Kazarovets and just got the following reply. David
Dear Dr. Boyd,
Thank you very much. I have revised the type of variability for NSV 11988 (LB instead RCB:) in the new (82-nd) Name-list we are preparing.Best wishes,
Elena KazarovetsDavid BoydParticipantHi Marc,
Welcome to the BAA spectroscopy forum. It is great to see someone with your experience joining us.
As you will have seen from some of the earlier posts to the forum, several of our members have recently acquired low resolution spectrographs such as the Alpy and LISA. It would be helpful if you could explain whether, and how, such low resolution devices can make a useful contribution to the VV Cep campaign. The analysis Ernst has been describing clearly requires high resolution H-alpha observations. If low resolution observations are useful, I am sure some of us would contribute.
Regards,
David
David BoydParticipantHi Tony,
Did you see the recent posts on the ARAS Forum about professional interest in the symbiotics SU Lyn and AG Dra? Consider adding these to your target list.
Cheers, David
David BoydParticipantHi Tony,
I’m not sure I understand your question. Measuring the instrumental and atmospheric response for a symbiotic is no different to any other star in that you want to use a reference star close in altitude and azimuth to the target and for which you have a good spectrum, so ideally a Miles library star but failing that a Pickles spectrum for the same spectral type as the reference star. It doesn’t need to have a spectral type similar to your target star. That should enable you to correct your measured spectrum to the exo-atmospheric spectrum of the target, whatever type of star it is.
Apologies if I’ve misunderstood what you were asking. If so, try again!
David
David BoydParticipantHi Tony,
That is the broad Raman scattered O VI line at 6825A. See http://articles.adsabs.harvard.edu/cgi-bin/nph-iarticle_query?1989A%26A…211L..31S&data_type=PDF_HIGH&whole_paper=YES&type=PRINTER&filetype=.pdf
It was a mystery for a long time until Schmid published his paper. It’s a trademark of symbiotic stars with high excitation nebulae.
David
David BoydParticipantHi Alun,
Congratulations, that’s a nice well calibrated and corrected spectrum. You should upload it to Andy’s spectroscopy database.
Cheers,
David
David BoydParticipantHi Alun,
That looks good. You can now see emission lines of H-alpha, H-beta and H-gamma plus the two [N II] lines bracketing H-alpha and the dip at 5896 due to Na absorption in our galaxy. You could get three independent estimates of the redshift from the three Balmer lines. I’m guessing you haven’t applied a correction for instrument and atmospheric losses? If you did this it would remove the hump and you’d end up with a relatively flat spectrum similar to this one on NED http://ned.ipac.caltech.edu/spc1/2006/2006ApJS..164…81M/NGC_2903_nuc:S:Opt:mk2006_sp.png
Cheers,
David
David BoydParticipantHi Alun,
If you don’t have the Alpy calibration unit, you can use the Balmer lines in your A-type spectrum to find the polynomial which maps pixels into Angstroms. You can use that to calibrate your galaxy spectrum independently of the sky background lines and use the sky sodium line as a check that everything is correct. You can then measure the galaxy redshift in km/s using the H-alpha line (delta lambda x 300,000 / lambda) which is always a satisfying thing to do with a small scope in your back garden. Once you have done the background subtraction, you will probably find a small absorption line at the sodium wavelength in your spectrum due to absorption of light from the distant galaxy by sodium in our own galaxy.
Cheers,
David
David BoydParticipantHi Alun,
According to the NED database http://ned.ipac.caltech.edu/forms/byname.html NGC 2903 has a redshift velocity of +550 km/s which corresponds to a wavelength shift at H-alpha of +12A. It’s hard to tell exactly from your plot but that looks close to what you are seeing. The NED database also contains spectra of the galaxy which show it has a fairly flat continuum with only a few strong emission lines at H-alpha, H-beta and (probably) [N II] at 6584A, all of which you see faintly. So the stronger emission lines you are seeing such as sodium D at 5896A (which is not redshifted) may be sky background lines. Did you subtract the sky background during processing?
David
David BoydParticipantThanks Andrew. These look very useful. Neither came up on a google search. Wrong search words I guess.
David
David BoydParticipantDo either of you know of a reference which quantifies the size of atmospheric chromatic dispersion as a function of zenith angle at sea level? A google search has not thrown up anything useful so far. All the references I can find address the issue for large telescopes on mountaintops. It is difficult to tell from Christian’s webpage what the actual size of the effect is.
David
David BoydParticipantThanks for your comments. There may well be another reason for the effect I’ve seen but I’m struggling to identify what it is.
I think it would be difficult to detect such an effect photometrically because of focus variation between filters.
My first thought was that it was the problem Christian identified with parallactic angle as I cannot set my LISA to that orientation because the cameras which project from both ends of the LISA foul the pier when near the meridian. However I would have expected the effect of that to be worse at the blue end.
Thanks for the reference Andrew, I’ll digest that tomorrow and keep thinking.
David
David BoydParticipantI’ve experienced the same problem as John with the same sequence of Miles spectra which Robin used. The response profiles calculated for each star give an excellent match with the Miles spectrum for that star but differ from star to star. All the spectra were taken over a period of an hour at an air mass of around 1.2 with no change to the equipment including focus and no obvious change in atmospheric conditions. However, I do live about 50 miles west of Heathrow and planes are flying over at high altitude all the time. I recently asked on the ARAS Forum if anyone have noticed changes in atmospheric response due to aircraft con trails but so far there has been no response. Possibly a bit of a long shot.
I repeated the exercise a few days later and found the same variation, again different response profiles from star to star but no consistency with the first set. I now plan to experiment with varying the position of the guide star relative to the slit for the same star to see what effect this has. That will not be for a while as the forecast here is bad for several days.
I’m using a LISA with a 23 micron slit on a C11 with a focal reducer operating at f/5.5. The slit size on the sky is 3.1″ which is a reasonable match to the seeing here. These is a noticeable fishtail on the spectra due to a combination of chromatic aberration in the LISA and the FR lens but I include the full fishtail that in the binning zone and do this with the same binning zone for all the stars. I use the optimal binning option in ISIS but switching that off has no effect on the derived response profiles. It is not a problem with smoothing the response profile as the effect is much larger than any variation that causes.
Cheers, David
David BoydParticipantHi John,
To get the value for the rms residual given by ISIS you need to calculate sqrt(sumsq(dlambda values)/6) because you have 11 lines and there are 5 parameters in the fit.
David
David BoydParticipantRobin,
That’s correct. If you add 1 to the CCD pixel positions (which are listed as x= in the Go window) before calculating the 4th order polynomial in Excel, then you get the coefficients ISIS displays in the Go window. However the calibration line dlambda residuals shown in the Go window are computed using a 4th order polynomial based on the original CCD pixel positions.
David
David BoydParticipantI use the File mode option under Spectral calibration on the General tab in ISIS 5.7.0. I give it a .lst file with a list of the calibration lines to use in the fit. ISIS then does fill in the calibration fit coefficients in the Dispersion window. It also highlights the 3rd order radio button in that window although the fit is 4th order.
One thing I have noticed is that these coefficients do not generate the correct residuals if you use them in a 4th order polynomial with the measured pixel positions for each calibration line listed in the Go window in the Go tab. If on the other hand you make a 4th order polynomial fit to the measured pixel positions and the correct line wavelengths using eg Excel and then use these coefficients to calculate the residuals for each line, you get exactly the residuals listed in the Go window. These coefficients are not the same as the ones listed lower down in the Go window and in the Dispersion window.
I have no idea what is going on there and where the coefficients listed by ISIS come from but they are not the coefficients of the mathematical fit which produces the residuals listed for each line in the Go window. Perhaps this is a consequence of using File mode calibration? I am only mentioning this in case anyone tries to use the coefficients listed by ISIS to reproduce the residuals and finds they get different answers.
David
David BoydParticipantHello,For me 2016 has been the best year as far as useable nights for observing is concerned since 2007. I work out my observing statistics as a percentage of the number of nights on which I was available to observe, so not on holiday, away from home or whatever. I managed to observe on 121 out of 267 available nights (45.3%). Best months were August and September, both with over 60% while May, October and November were over 50%. January was the worst with only 28%. In total 18950 images were recorded and measured during 609 observing runs, and 2856 spectra recorded during 144 runs.Clear skies for 2017 – my last night of 2016 is distinctly overcast!David -
AuthorPosts