Forum Replies Created
-
AuthorPosts
-
 David BoydParticipant
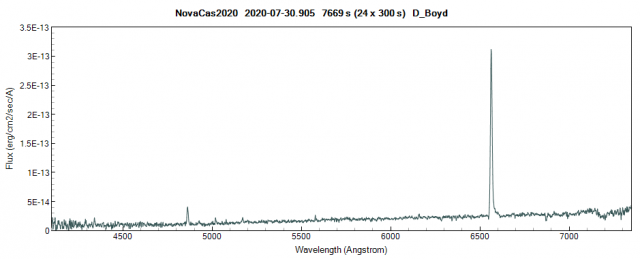
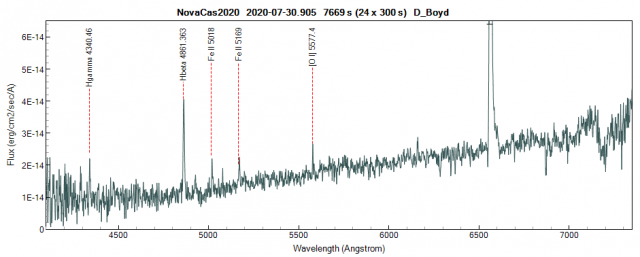
Here is a spectrum of Nova Cas 2020 recorded with a LISA spectrograph on a C11 SCT and calibrated in absolute flux using a concurrently measured magnitude of V = 13.395. Using PlotSpectra, the integrated absolute flux of the H-alpha and H-beta lines are 3.53E-12 and 2.52E-13 erg/cm2/sec respectively. These results are consistent with the values 3.54E-12 and 2.54E-13 reported in ATel 13905. The apparent FWHM of the H-alpha line is 508 km/s and there is evidence of weak P Cyg absorption on the blue side of H-alpha extending to -800 km/s relative to the peak of emission. There are also emission lines of Fe II 5018, Fe II 5169, [O I] 5577 and an unidentified emission line at ~6160 A.
David
 David BoydParticipant
Hello Keith,
Welcome to the exciting (and challenging) world of spectroscopy! You are clearly well-equipped. There are some useful resources on the BAA Equipment and Techniques section webpages at https://britastro.org/node/19378. Francois’ book is also a good resource and a good guide for a beginner to get up to speed.
There is an active online discussion group on spectroscopy mainly based in the US but including some of us in the UK which is coordinated by Woody Sims in Phoenix. Several of us now have LISA spectrographs. I will ask Woody to make contact with you.
It looks from the spectra you have posted that you have some problems with wavelength calibration as the Balmer lines in your spectra do not always lie at the correct wavelengths. I have been using Christian Buil’s ISIS software to process my spectra for a long time but have just started looking at Demetra. It has a good facility for checking how well it is locating the lines in your calibration spectrum so it is worth spending some time working with that. You should be aiming for an rms value of around 0.1 with a LISA. Make sure your LISA is well focused and that you are not saturating the lines in the calibration image.
So try to master wavelength calibration first then move on to response correction. This involves taking the spectrum of a reference star whose spectrum you can find in a library and using that to generate a smooth response profile which will enable you to correct the spectrum of another star for atmospheric and instrumental losses. The reference star should be close in airmass (=altitude) to your intended target star so the atmospheric correction will be the same. You can find spectra of possible reference stars in the MILES library (these are actual measured spectra) or in the Pickles library (these are synthetic spectra of the main spectral types). There is a useful spreadsheet which will give you a list of possible MILES reference stars close to a specific location in the sky at a specific time here
http://www.spectro-aras.com/forum/viewtopic.php?f=8&t=941
Try to pick stars which are main sequence stars (spectral class V) and have spectral types B or A as these have spectra with a smooth continuum which makes it easier to generate a smooth response profile in Demetra.
There is also a lot of information available on the ARAS spectroscopy forum at http://www.spectro-aras.com/forum/index.php and that is also a good place to ask questions as many active spectroscopists use it.
That’s probably enough information to keep you busy for now. It’s good to have you in the amateur spectroscopy community. There is much useful work to be done.
Best wishes,
David
David BoydParticipantThanks Andrew, these are useful references.
When Christian Buil wrote ISIS he recognised that once you subtracted the bias or offset signal, the remaining dark current in CCD cameras scaled linearly with exposure time. A dark frame taken with the longest exposure time could therefore be scaled to any other exposure time required. Hot pixels behave differently and are dealt with separately in ISIS. Exposures in spectroscopy can vary from 10 sec on a bright reference star to 600 sec or more on a faint target, so a set of darks at every exposure time with sufficient images per set to reduce statistical noise could potentially take hours to record. The approach taken in ISIS was a pragmatic solution. With temperature regulated cameras such a dark frame could have a relatively long useful lifetime.
With CMOS cameras having low readout noise per exposure and nonlinear dark frames, this approach may need to change.
David
David BoydParticipantThis could be an issue in spectroscopy as the widely used ISIS software uses the scaled darks technique.
Do you have a reference for the evidence of non linear amp glow?
David
David BoydParticipantI use AIP4WIN for aperture photometry. My pragmatic approach in trying to measuring SNe is to choose an aperture for the SN itself which extends out to where the SN light distribution blends into the background but no further. Then a small gap of a couple of pixels followed by an annulus which includes at least 10 times as many pixels as contained in the central aperture. This will inevitably include light from the surrounding galaxy but the distribution of this light is likely to be a gradual slope as you move away from the galaxy core. The annulus will record an average of this background intensity which should be reasonably representative of the galaxy background under the SN itself. You can try varying the various radii involved to see how stable the result is. As I say this is a pragmatic solution and not perfect but in my experience it seems to give a result consistent with other reports.
David
David BoydParticipantThis spectrum of type 1a supernova SN2020hvf was taken on 11 May with a LISA spectrograph (R~1100) on a C11 and has been calibrated in absolute flux using a V magnitude of V=12.67 measured concurrently with the spectrum using another scope. The spectrum has been smoothed with a Gaussian factor 2.5.
The blue-shifted location at 6118A of the prominent Si II 6355A absorption feature indicates an expansion velocity of ~11,200 km/s.
David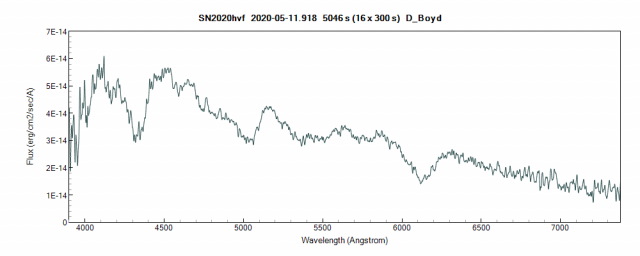 David BoydParticipant
These two spectra of C/2019 Y4 (ATLAS) were taken on 26 March (blue) just before the recent disruption of the comet and on 6 April (black) after. Both were taken with a LISA spectrograph on a C11 and are integrations of 130 and 90 mins respectively. Reports indicate that the event has reduced the brightness of the comet by about a magnitude and it has become more diffuse. This was apparent from the increased difficulty in guiding on the comet in the later spectrum. The later spectrum also suffers from greater noise beyond that expected just from the reduced exposure time. However, it appears that the event has not introduced any significant change in the spectral profile of the comet.
 26 March + April 6 2020.png) David BoydParticipant
David BoydParticipantHi James,
I have heard nothing more from Richard Berry about availability of AIP4WIN. The stumbling block seems to be the attitude of the owner of Willmann-Bell Perry Remaklas. I have also used AstroImageJ and confirmed that it gives the same results as AIP4WIN but I find it a bit awkward to use just for photometry.
AIP4WIN does run successfully on Windows 10 if you follow the instructions and remove all previous versions first.
David
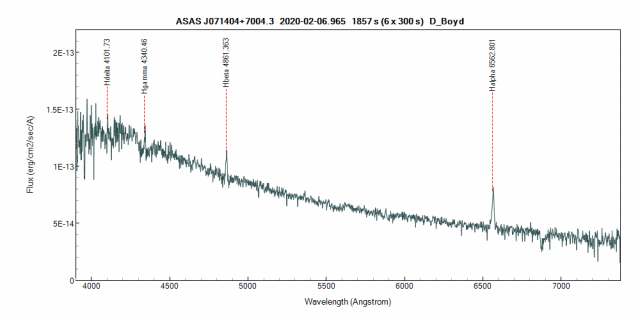
David BoydParticipantA low resolution spectrum taken last night with a C11 + LISA spectrograph confirmed it is likely to be a CV with a strong blue continuum and Balmer emission lines. Clouds prematurely terminated the run after 30 mins. Concurrent B and V band photometry showed variation of ~0.08 mag possibly caused by flickering in the accretion process. B-V colour index is 0.075. The concurrently recorded mean V band magnitude was used to flux calibrated the spectrum.
David
 David BoydParticipant
Although subjectively it seems to have been a poor year, probably influenced by the recent persistent clouds, the evidence shows otherwise. I am in South Oxfordshire in the UK.
I always calculate my statistics as the proportion of the nights when I was potentially able to observe (ie not away from home or otherwise engaged) that I did actually record useful observations, either photometry and/or spectroscopy. It is a reasonable assumption that if I had been available every night of the year, this is the proportion of nights when I could have observed.
Over the previous 14 years my annual average has been 42.1% of nights when I was able to observe. The std dev on this is 2.9% and the trend is absolutely flat – conditions have been very consistent over this period.
In 2019 the proportion of observable nights was 41.2%. Over the year there has been considerable variation. In Jan, Feb and Nov the monthly figures were all below 27%. In Jul, Aug and Sep they were >57%. However this variation is no worse that in previous years.
Best wishes for (more) clear skies,
David
David BoydParticipantHi Nick,
This is based on a .lst file I was originally given, I think by Olivier Thizy when he was at Shelyak, containing emission lines which are present in the Ar/Ne calibration lamp which they supply.
To use it with ISIS you select file mode in the General tab, type the .lst file name in the box, and then on the Calibration tab you specify the wavelength of one of the lines in the calibration lamp spectrum in the “X coordinate of line at wavelength” box. I use the line at 5852.488 A which in my calibration lamp spectrum is the brightest line close to the middle of the spectrum. Then place the cursor over the centre of that line in the display of the lamp spectrum below and double click. ISIS then fills in the X coordinate of that line in the adjacent orange coloured box. When you then hit “Go” it should correctly identify the location of all the other lines in the .lst file and wavelength calibrate your spectrum.
If you still have problems email me off list and I will try to help further.
David
David BoydParticipantHi Kevin,
In quiescence, during your first 3 spectra, SS Cyg has a relatively stable accretion disc which is being fed from the secondary star and is in turn transferring this hydrogen-rich material onto the surface of the white dwarf. This process produces the Balmer emission lines you see in the quiescent spectrum. When the star goes into outburst, the temperature of the disc increases elevating the blue end of the continuum, singly ionised helium HeII lines appear, and the opacity of the disc increases which absorbs some of the emerging light generating the absorption component of the spectral lines and reducing their emission component. This is a rather simplified description but conveys the general picture.
If you want to see how you can accurately flux calibrate your spectra using a V magnitude, have a look at my workshop slides in the spectroscopy section of the E&T website.
David
David BoydParticipantHi Robin,
The level of the background sky in my LISA images is very flat in the Y direction, much as you have found. The flat lamp image as recorded is not flat, probably due to the different light path from the lamp into the spectrograph. So I think applying the vertical gain correction results in a better flat correction.
David
David BoydParticipantThere is a preprint in arXiv this morning about this object at https://arxiv.org/abs/1909.05851
24 June 2019 at 10:53 pm in reply to: 4th European Variable Star meeting (EVS2019), Sept 14-15 2019 #581171David BoydParticipantI am forwarding the following message on behalf of Josch Hambsch:
Dear BAA members,
The preliminary program of the EVS2019 is now online. You can find it under the Program tab on the website http://www.EVS2019.be. You are welcome having a look.
You are also still welcome for a presentation.
I look forward to welcome BAA members in Belgium.
Best regards,
Josch Hambsch
Organizer EVS2019
David BoydParticipantI made it V=18.6 last night 23rd May so this may finally be the end of the outburst.
David
David BoydParticipantAL Com is heading down again, V=15.93 on 2019 05 16.918.
David
David BoydParticipantDuring 2018 I was able to obtain photometry and/or spectroscopy on 111 nights out of 261 when I was at home and available to observe. Assuming this proportion was representative of the whole year, this suggests observations would potentially have been possible on 42.5% of nights during the year (in South Oxfordshire). This is very close to my average over the past 14 years (42.1%) so for me 2018 was a very average year. The best months were May (61.5%) and August (60.0%), the worst March (22.7%) and December (21.7%). My records show 14,890 photometry measurements and 2,663 spectra recorded during the year. Although not nearly as noteworthy as Gary’s visual observation record, I see my photometry measurements passed the 400,000 mark during the year.
Best wishes for clear(er) skies during 2019.
David
David BoydParticipantThe AAVSO maintains a list of observing campaigns at https://www.aavso.org/aavso-alert-notices-for-observing-campaigns-and-discoveries
A recent example was the request from Dr Moritz Guenther at MIT for observations of Herbig Ae/Be stars which he and colleagues were planning to observer with the X-ray satellite Chandra. https://www.aavso.org/aavso-alert-notice-658
These are practical opportunities for amateurs to make a useful contribution to the progress of science. Those of us who participated have received encouraging positive feedback from him.
David
David BoydParticipantLISA spectrum, 4500 sec integration, very similar to Robin’s above.
According to a recent email to the CBA group by Tonny Vanmunster reporting observation of superhumps, it is a probably an AM CVn type dwarf nova.
David
-
AuthorPosts