Forum Replies Created
-
AuthorPosts
-
 David BoydParticipant
A beautiful example of what can be achieved with high quality equipment and very compliant weather!
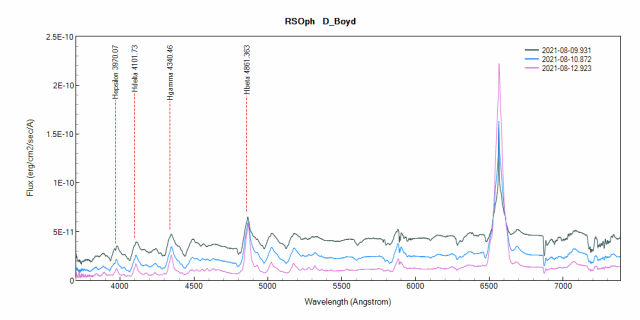
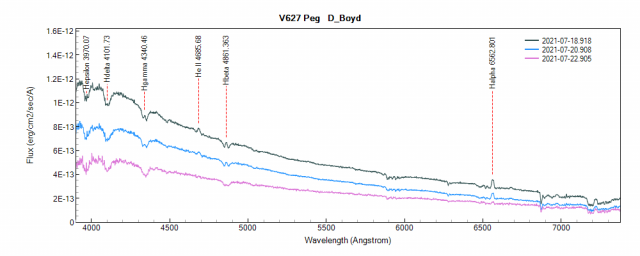
DavidDavid BoydParticipantThe continuum flux level of the spectrum is dropping as the magnitude fades, V=4.88, 5.44, 6.24 for the 3 spectra below.
In answer to Hugh’s question above about the changes which have been taking place in the Balmer emission lines, I have posted information about this on the ARAS Forum at
http://www.spectro-aras.com/forum/viewtopic.php?f=36&t=2804&start=30#p15940
David
 David BoydParticipant
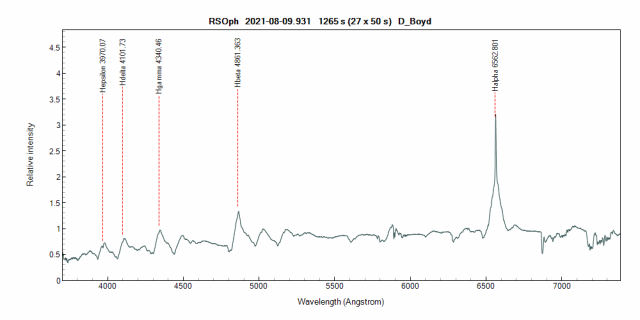
Here is a spectrum of RS Oph in outburst taken tonight, 9th August, with a LISA. Very sharply peaked H-alpha line with FWZI of about 7000 km/s. Other Balmer lines similarly broad, all with P Cygni absorption dips. I don’t remember seeing a spectrum quite like this before!
David
 David BoydParticipant
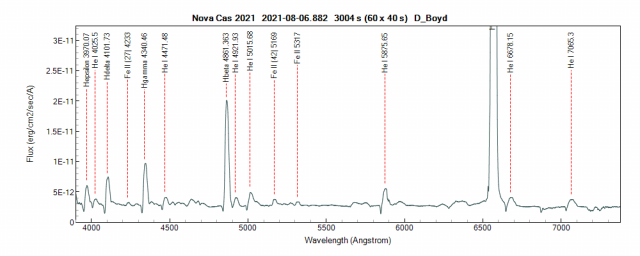
Here is a spectrum of Nova Cas 2021 taken on 6th August with a LISA (R~1065) and calibrated in absolute flux using a concurrently measured V magnitude of 7.70. There are broad emission lines of H I Balmer and He I, all with P-Cygni absorption dips, and weak Fe II emission lines with double peaks. The H-alpha line is so strong that exposures had to be kept to 40 sec to avoid saturating. Further information about the spectrum and more plots can be found on the ARAS Forum at
http://www.spectro-aras.com/forum/viewtopic.php?f=36&t=2744&p=15888#p15888
David
 David BoydParticipant
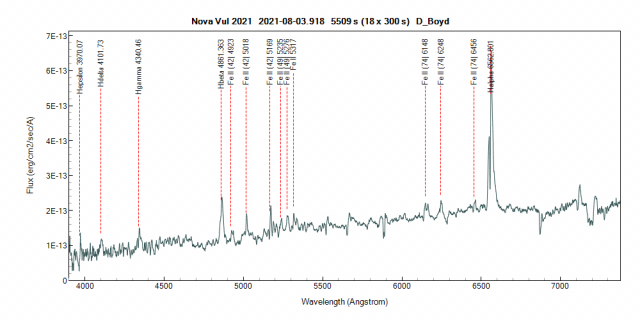
Last night, 3rd August, I measured Nova Vul 2021 at V=10.97, B-V=1.14, almost a magnitude fainter than 48 hrs before and slightly redder. As Robin said, there has been a big change in the spectrum over recent days.
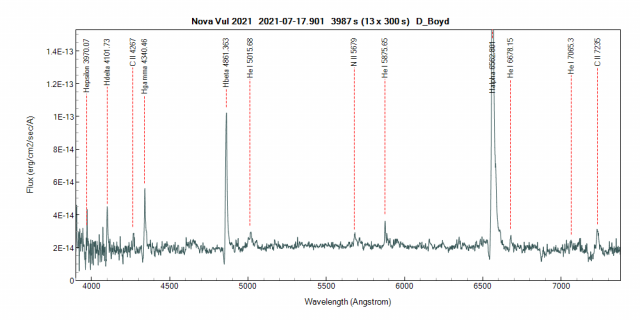
The following LISA spectrum (R~1062) was calibrated in absolute flux using this V magnitude and response corrected with the B9III MILES star HD192907 recorded at the same airmass as the mid-time of the nova spectrum. H-alpha has a strong P-Cyg absorption dip at -320 km/s which now falls within the much broader ~3000 km/s FWZI of the line. FeII multiplets 42, 49 and 74 are prominent with just-resolved P-Cyg dips. There are also emission features at ~5526A, ~5662A and ~7117A, all with P-Cyg dips, which I have not been able to identify in the WIlliams list of nova emission lines. Suggestions?
David
 David BoydParticipant
I confirm what Robin reported above that the emission cores of the Balmer lines have progressively disappeared over the past 4 days. The spectral profile and flux of the star are now very similar to what they were on 15th July shortly after the outburst was detected.
David
 David BoydParticipant
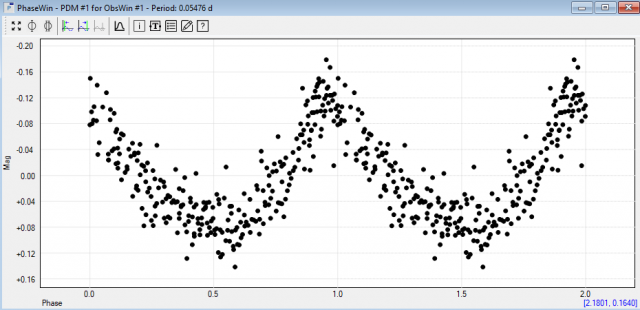
Recent V-band data on the AAVSO website show strong modulation close to the orbital period of 0.05408978(5) d reported by John Thorstensen.
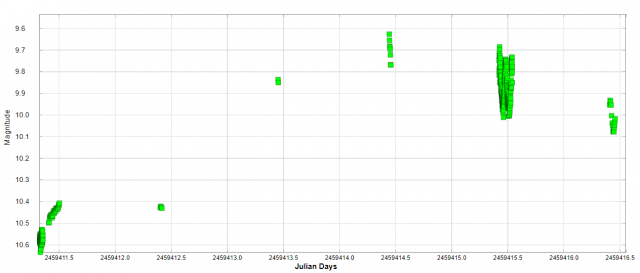
Peranso PDM analysis of 3 night’s data.
Spectra calibrated in absolute flux follow the changing brightness of the star with the Balmer lines evolving from initally pure absorption to now having emission cores.
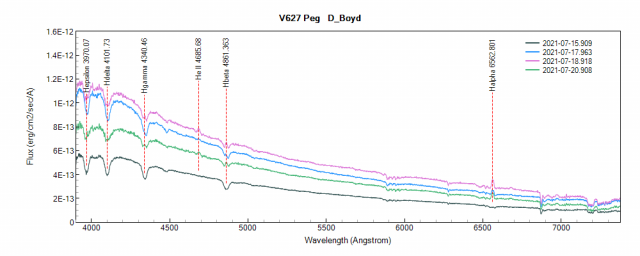
David
David BoydParticipantHi Robin,
As I just posted in reply to your question on the ARAS Forum, I think these lines are C II which are seen in He/N novae.
This spectrum was recorded last night 17th July with a LISA and calibrated in absolute flux using the concurrently measured V magnitude of 13.10.
David
 David BoydParticipant
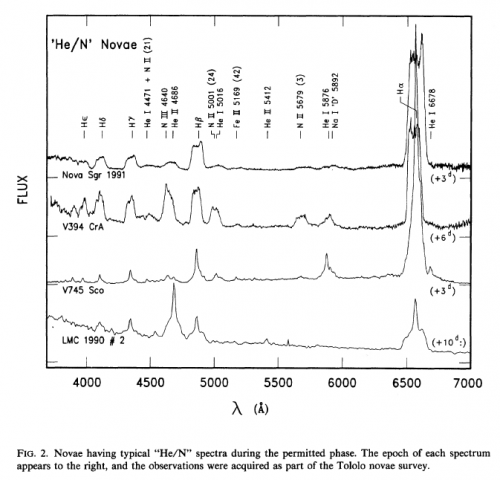
Those following the class of this nova may be interested to know that the recent ATel 14728 has reported that it now looks more like a He/N nova than Fe II as was being reported by ATels up until June 16th. This change actually happened within 36 hours of its discovery on June 12.54 UT as this compilation of amateur spectra shows. Compare these with the spectrum of Nova Sgr 1991 in figure 2 of Williams, The Formation of Novae Spectra, AJ, 104, 725 (1992).
David

 David BoydParticipant
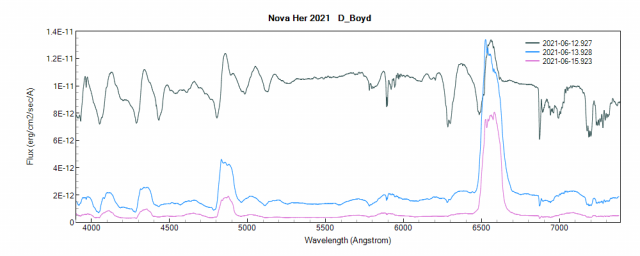
Further to Robin’s posting, the following plot shows the change in absolute flux of the nova over the last 4 days. These R~1000 spectra have been calibrated in absolute flux using concurrently recorded V magnitudes of 6.35, 8.38 and 9.77 respectively as described here.
David
 David BoydParticipant
The spectrum now looks very different from last night with strong and very wide Balmer emission lines.
David
 David BoydParticipant
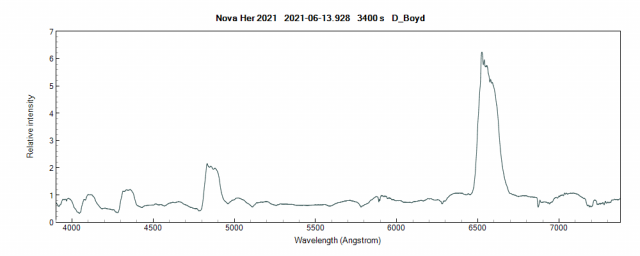
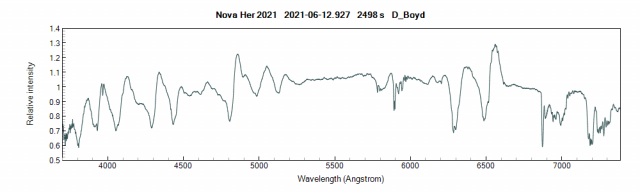
Here is a low resolution R~1000 spectrum of the new bright object in Her. Taken with a LISA on a 0.28m SCT.
This has been instrument and atmospheric response corrected.
David
 David BoydParticipant
Hi Jeremy,
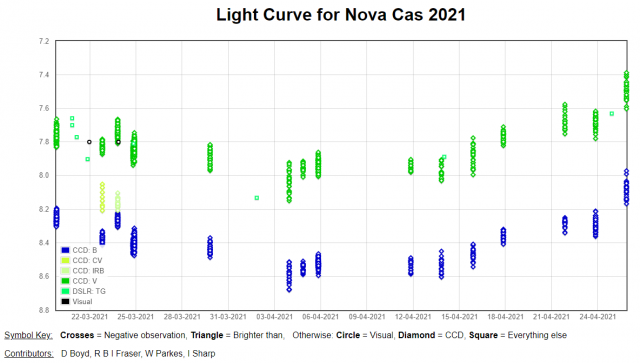
The BAA light curve shows it has been rising steadily for the past 2 weeks.
David
 David BoydParticipant
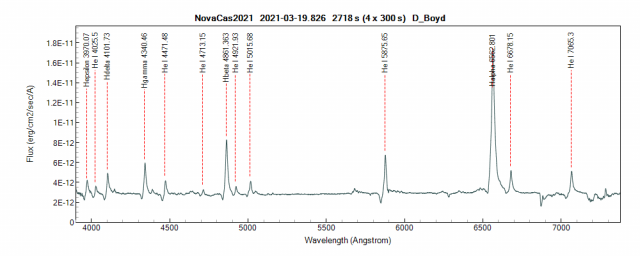
This spectrum of Nova Cas 2021 was recorded with a LISA spectrograph on a C11 during a short break in generally overcast skies tonight. It shows strong emission lines of the hydrogen Balmer series and He I. There are P Cygni profiles extending to around -2500 km/s relative to the rest wavelength on all emission lines. The spectrum was calibrated in absolute flux using currently recorded B and V photometry which gave V = 7.77+-0.04 and B-V = 0.50.
David
 David BoydParticipant
Happy New Year!
My statistics for the year show it to have been an average year as far as observing is concerned. Because of the virus, apart from a few nights early in the year I was at home and available to observe every night if conditions permitted. My results show that I actually observed and obtained photometry on 40.1% of available nights (137 out of 342) with the best months being April, May and September (as usual) and the worst February and October. I also obtained spectroscopy on 114 nights.
Regards,
David25 December 2020 at 4:14 pm in reply to: Gyulbudaghian’s Nebula imaged on two nights in mid November 2020 #583615David BoydParticipantI found PV Cep at 16.72 in an Rc filter last night, 24th Dec. This is close to its brightness back in July before the recent deep fade. David BoydParticipant
Hi Andrew,
Thanks, that will be useful. The CALSPEC files at STScI are Multi-Extension FITS files and can’t be read by ISIS. I had the same problem reading files in NGSL and also wrote a Python script to turn them into Basic FITS files.
The range of the commonly used BVRI Johnson-Cousins filter passbands is from about 3600 A to 9750A in case anyone wants to use the CALSPEC files to calibrate flux for the other filters.
The UVEX claims to cover the range from 3500 A to 10,000 A and the upper limit of the LISA IR version is also 10,000 A so the range you suggest looks good.
Probably the best place to put it on the BAA website would be in the Equipment & Techniques Section webpage on Spectroscopy.
If you ask David Arditti he can put it there.
David
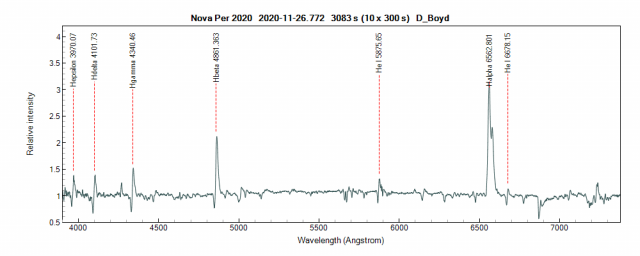
David BoydParticipantThis is the first of two spectra I was able to record last night, 26th Nov. Thick fog eventually ended observations. The H Balmer and He I emission lines have prominent P Cygni dips on their blue edges caused by absorption in the material expanding towards us from the nova explosion.
David
 David BoydParticipant
David,
There have been several articles in the CAP Journal (Communicating Astronomy with the Public) on this theme. Some of these may be useful.
https://www.capjournal.org/issues/15/15_05.pdf
https://www.capjournal.org/issues/17/17_36.pdf
https://www.capjournal.org/issues/20/20_35.pdf
https://www.capjournal.org/issues/21/21_36.pdf
https://www.capjournal.org/issues/23/23_20.pdf
David
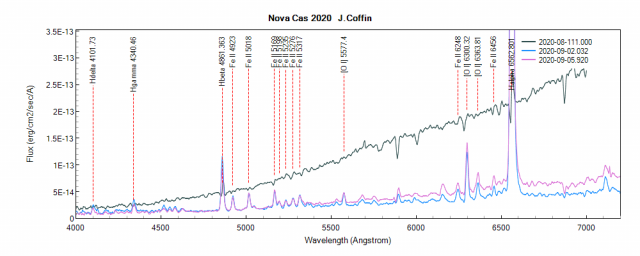
David BoydParticipantJohn,
I calibrated your 3 spectra in the BAA database in absolute flux using V magnitudes interpolated at the times of your spectra from V magnitudes in the AAVSO photometric database. I have labelled the main emission lines which include the Balmer series of hydrogen recombination lines and collisionally excited lines of singly ionised iron Fe II. The latter have strengthened during the recent rebrightenings of the nova. There are also forbidden lines of oxygen [O I] formed in the lower density expanding nebula.
David
-
AuthorPosts
There was no trace of the nebula in a stacked exposure of 29 mins although the sky was slightly milky and the moon was bright.
David