Forum Replies Created
-
AuthorPosts
-
 Andy WilsonKeymaster
Hi Steve,
I’d also like to thank David and Ann for organising such a great weekend, and to Francois Cochard for all the work he put into the presentations and demonstrations. Thanks for your kind words on the database. Watch out for an announcement sometime soon..
I would also like to re-emphasize to everyone who attended the weekend, and to all BAA members, the forum is a great place to ask questions and share results, even if your results don’t look right. Starting out in spectroscopy is hard. One of the tools that makes this possible today is the internet. It is quick and easy to share results and ask questions. Remember there is no such thing as a stupid question. There are probably others out there struggling with the same problem as you.
If anyone from the weekend has trouble accessing the forum then drop me an email.
Best wishes,
Andy
Andy WilsonKeymasterHi Tony,
Thanks for the file. I’ll be at the spectroscopy workshop, so hopefully there will be a chance to discuss photometry file formats.
I’m unlikely to have the time to work on this until next year. I’m studying at weekends and have several meetings to attend in the run up to Christmas. Once my schedule has calmed down, then that will be the ideal time to look at the format in more detail and make the changes. Having sample files to work with will be a big help, as I’m not currently setup to do my own photometry.
Cheers,
Andy
Andy WilsonKeymasterHi Graham,
You could also try emailing William-Bell to see if you can get hold of the book and software, or maybe just the software if they have run out of the books.
http://willbell.com/contact.htm
The other thing to watch out for is if you find a copy to make sure it is version 2. William-Bell used to offer an upgrade from v1 to v2, but I’m not sure if that is still available.
Andy
Andy WilsonKeymasterHi Tony,
AIP4Win MMT does not produce files in the BAA VSS format. It is on my list of things to do to amend the VSS Photometry spreadsheet to read the MMT files, but that is likely to be at least a few months away. (Anyone could create a spreadsheet or other application to do the conversion but I suspect it will wait be me to produce something.)
Another one of the items on my to do list is to investigate building compatibility in to the VSS Database website for loading the AAVSO data format. The main issue here is the last time I reviewed the AAVSO format it did not provide all of the data we store in the BAA VSS database. However, we may just accept that we do not get all of the data.
I’ve not had a chance to look at the MMT format recently, so perhaps you could email me a copy? That will give me an idea of how much work the development will be.
Thanks,
Andy Wilson (BAA VSS Database Secretary)
Andy WilsonKeymasterCongratulations Robin. A great achievement to take the confirmation spectrum for a mag 16 supernova!
Cheers
Andy
Andy WilsonKeymasterThat is a fabulous spectrum for such a faint target Robin. A shame you were clouded out but this is another demonstration of what you can achieve with your setup.
Andy
Andy WilsonKeymasterI very much hope that a digital subscription will be rolled out as an option to all members in the near future. I would like to take advantage of this cost efficient way of being a member, with the ability to access to the journal and handbook online. I subscribe to a number of astronomical organisations and magazines and the annual total is not insignificant. So I applaud initiatives like this.
Andy
Andy WilsonKeymasterHi Alun,
Nice spectra! I’m interested to hear about your setup as that is something I had contemplated. A low res spectrograph on a small telescope, piggy backed on a larger telescope with a high res spectrograph. I thought getting the slits aligned would be just about impossible, so I’m very interested and impressed to see that you have achieved it.
Well done!
Andy
Andy WilsonKeymasterHi Bill,
That is a very interesting comparison between your Perseid spectrum and the VLT meteor. Encouraging that they show a similar continuum and line profiles.
Cheers,
Andy
Andy WilsonKeymasterThanks for posting this Calum. Very interesting that spectroscopy is gradually getting more coverage.
I’m tempted to watch, but as there is a cost and it is more targetted at those starting out in spectroscopy I’ll probably give it a miss. Still very pleasing that S&T are showing an interest in spectroscopy.
Cheers,
Andy
Andy WilsonKeymasterGreat spectrum Alun! That is a good demostration of the effects of the instrument and atmosphere.
Andy
Andy WilsonKeymasterHi Wayne,
It was good to meet you before the meeting. I used to live in the South East and was a regular visitor to meetings and the pub afterwards. A really enjoyable way to meet new people and chat about astronomy. Unfortunately now I’m in the South West I had to leave before the end of the meeting to get home by midnight!
I hope to meet you for a longer chat at a future meeting.
Andy
Andy WilsonKeymasterHi Bill,
Great idea to try out a narrow band filter with a full aperture white light filter. Your results look pretty good.
Andy
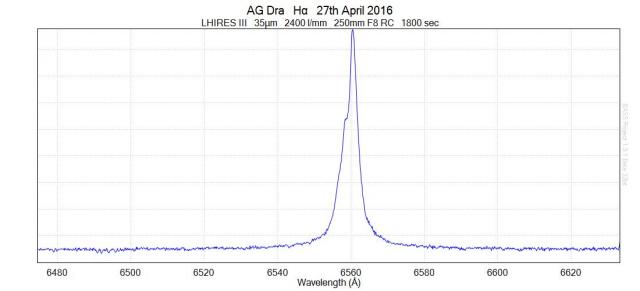
Andy WilsonKeymasterA fascinating post David. It encourages me to take the next step and learn flux calibration.
Below is an H-alpha spectrum I obtained on 27th April. It is interesting to contrast that though I see detail in the profile, I miss even the nearby little blueward absorption line and redward emission line that you pick up. A good example of how low resolution and high resolution spectroscopy can complement each other.
Best wishes,
Andy
Andy WilsonKeymasterMy browser was playing up and I’ve removed a duplication of my previous comment.
Andy WilsonKeymasterHi Robin,
I expect that observing a very red star made a big difference in how faint I could go. I could not find any R magitude measurements but I’m sure it would have been brighter than 13th mag through an R filter.
There is also of course a difference between obtaining a high quality spectrum, and simply looking for a detection of whether or not H-alpha is in emission. My next challenge will be to learn to flux calibrate my spectra, so I can properly analyse the intensity changes for a future cycle of chi Cyg.
Best wishes,
Andy
Andy WilsonKeymasterHi Steve,
I think chi Cyg near minimum would make an excellent challenge for the Alpy, and it is only getting brighter. You would be able to see how the whole of the spectrum changes rather than just H-alpha.
A quick back of the envelope calculation. Your refractor has about a quarter of the light gather power of my RC. However, if I make the assumption that I can use resolution as an approximation to how dispersed the spectrum is across the chip (lots of assumptions..). My Lhires III has approximately 20 times the resolution of your Alpy, so you should get a spectrum that is about 20x brighter. So overall you might get 4-5x the intensity that I do. This is of course a very rough calculation, and it also assumes we get a similar throughput through the spectrograph slit, which is affected by a number of factors. I used my widest slit at 35 micrometers.
Thanks,
Andy
Andy WilsonKeymasterHi Bill,
They were actually not that long compared to some deep sky imagers. The 27th April spectrum was from a 1 hour exposure, made up of 6 x 10 minutes. For some targets I’ve gone out to 2 hours and I would have liked to have done that or more for chi Cyg but there is a limit to how late I can stay up until with work the next day.
I suspect chi Cyg is a little easier than some mag 13 stars, as that is a V filter magnitude. It is a very red star, and even more red at minumum, so there will be more light around H-alpha which is in the red part of the spectrum. Also, whenever there is an H-alpha emission line, then it is easier to get a good signal on a faint star, as a lot of light is concentrated in a narrow emission line.
Cheers,
Andy
Andy WilsonKeymasterThat’s a great investigation Bill. Fascinating to see the orbit of the meteor to go with the spectrum.
The instrument response correction cannot be easy over a wide field. At high resolution on a star, it is surprisingly straight forward once you’ve done it a few times as it is for a narrow part of the spectrum on a tiny field of view. (Though somehow I’ve managed to get a dodgy response curve tonight, but it is still clear so I can redo it.) It must be quite a challenge for meteor spectroscopy through a wide angle lens across a wide spectral range,
Cheers,
Andy
Andy WilsonKeymasterThat is brilliant news for Bill and Harold. Congratulations to Bill!
Andy
-
AuthorPosts