Forum Replies Created
-
AuthorPosts
-
 Mr Ian David SharpParticipant
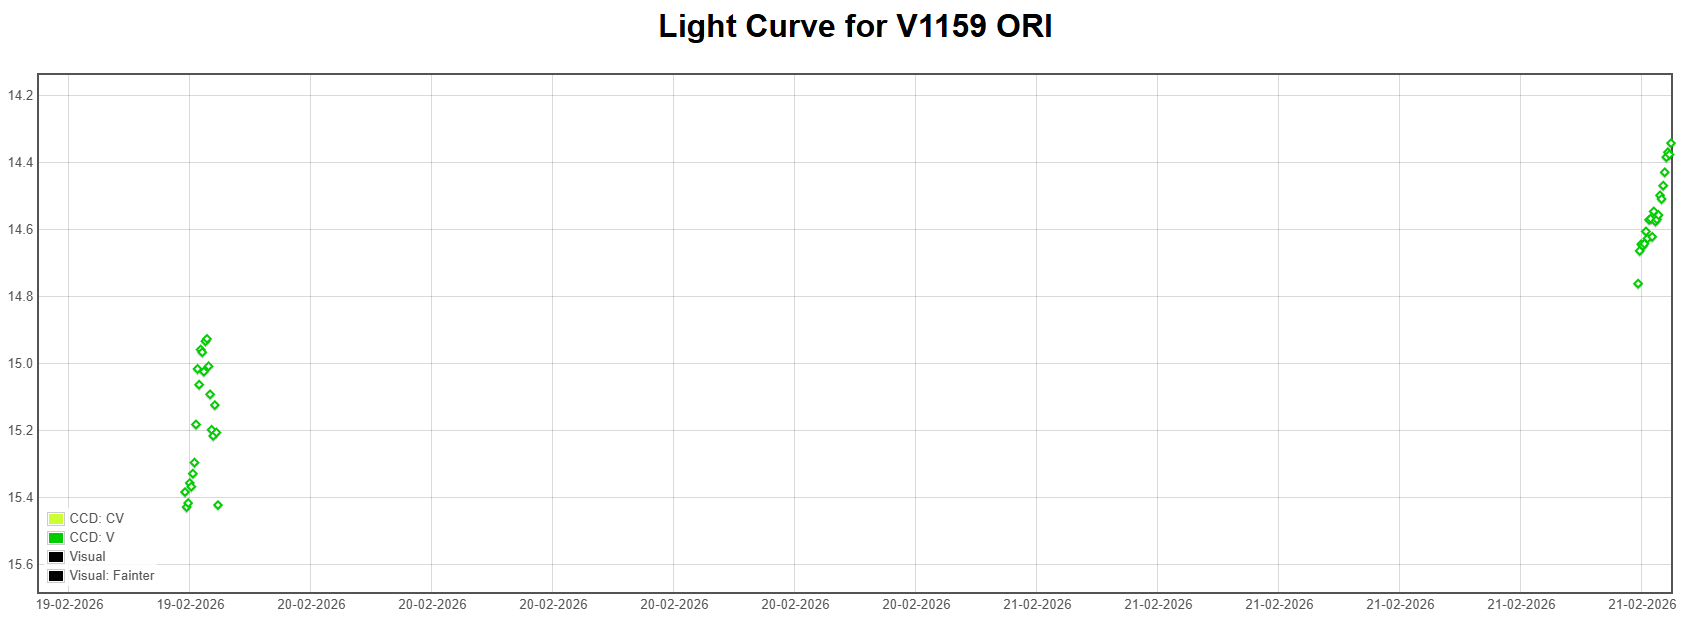
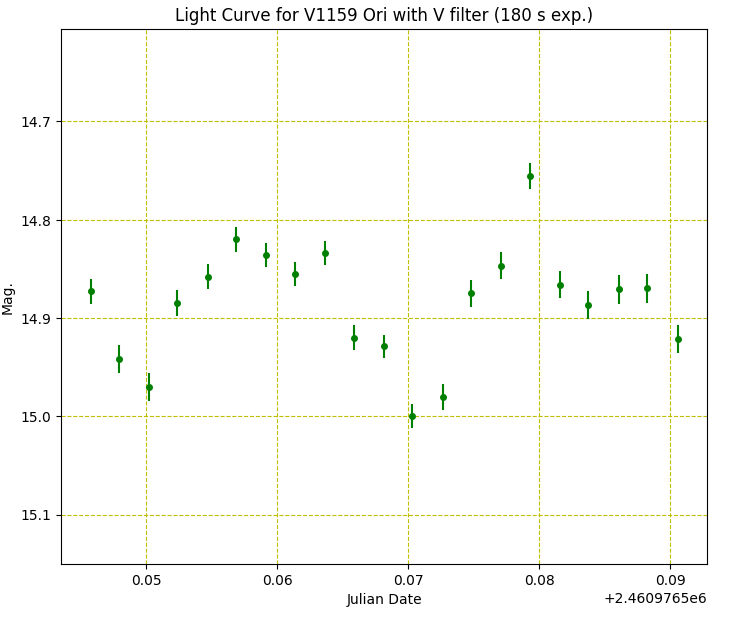
Hi Stuart,
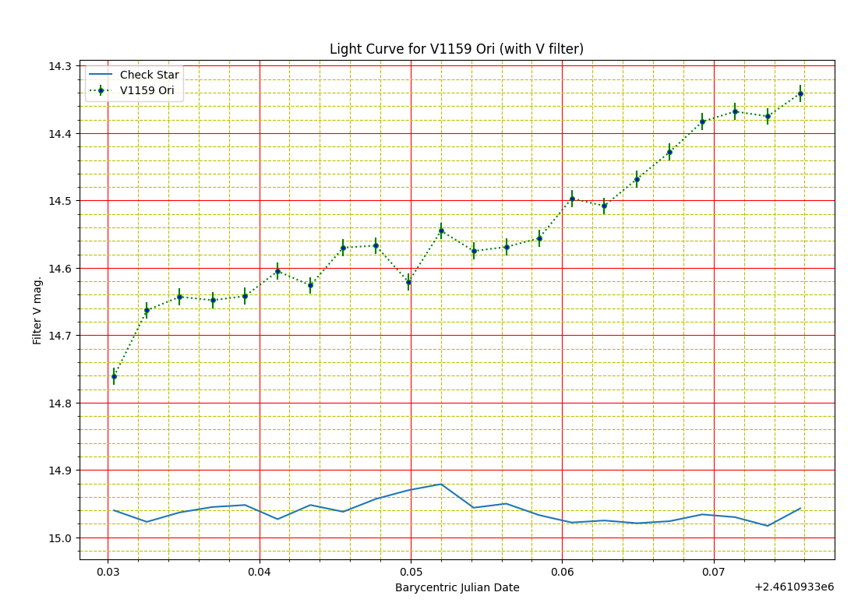
Just to say that V1159 Ori has brightened quite a bit over the past few nights. It’s brightened by nearly a full magnitude in V from 19th Feb to last night (21st Feb). See attached. I’m also attaching just last night’s light curve where it brightened consistently.
Cheers
Ian.Attachments:
Mr Ian David SharpParticipantHi Grant,
I haven’t used ASCOM drivers for Canon cameras myself, but what I have used are these remote control devices:
They are very convenient and you don’t need a PC at all. Easy to use and learn.
Just a thought.
Ian.
Mr Ian David SharpParticipantNow that is very sad. He was such a nice chap.
I will always remember him at a Sky at Night Perseids night at Patrick’s in Selsey some time in the noughties. Allan emerged around midnight from doing an interview for the programme into the garden where we were already settled watching for meteors when Allan started wrestling with a sunbed in the dark. The air turned blue and I remember him saying “Oh Lord! I’m such a troglodyte!” to much laughter.
RIP Allan.
Ian.
Mr Ian David SharpParticipantThanks Callum!
Mr Ian David SharpParticipantHi Grant,
As Nick says, the beauty of the SCT is that you can make huge changes in focus with the knob that moves the primary mirror. You need to set the Moonlite so it is in the middle of it’s travel, then go to a nice bright star and focus with the main mirror knob (you might need to loosen the mirror lock knobs if you have them). Then you can re-lock the primary (if applicable) then you can use the Moonlite from then on. Note that the star might be hugely out of focus which van be confusing. If in doubt, I use the Moon, or distant objects in the day.
Cheers
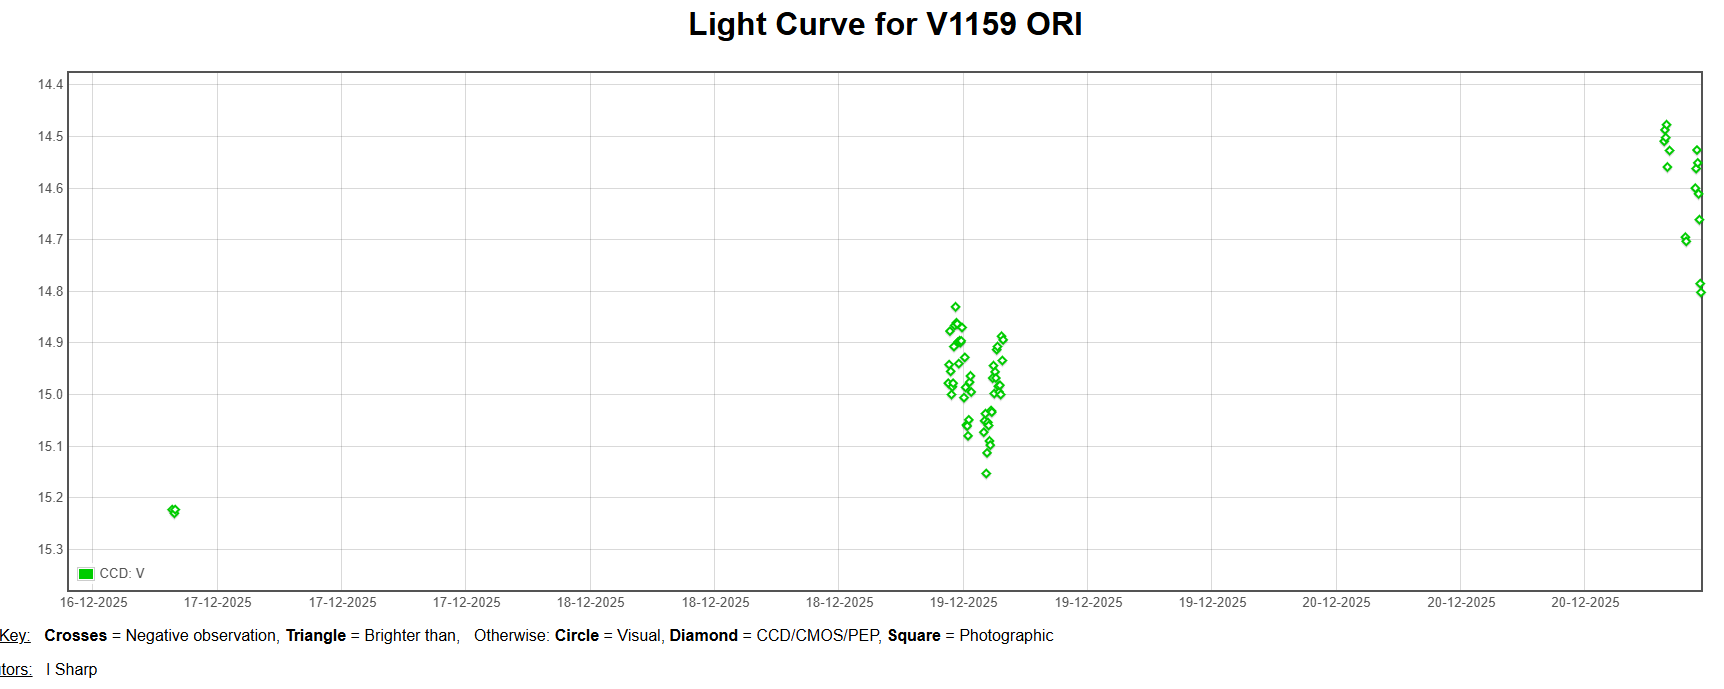
Ian.Mr Ian David SharpParticipantMr Ian David SharpParticipantHi Stewart,
I’ve noticed a brightening from around 15.2V on 16th Dec. to around 14.6V last night (20th Dec). See attached.
Cheers
Ian.Attachments:
Mr Ian David SharpParticipantThis has been sold – thanks.
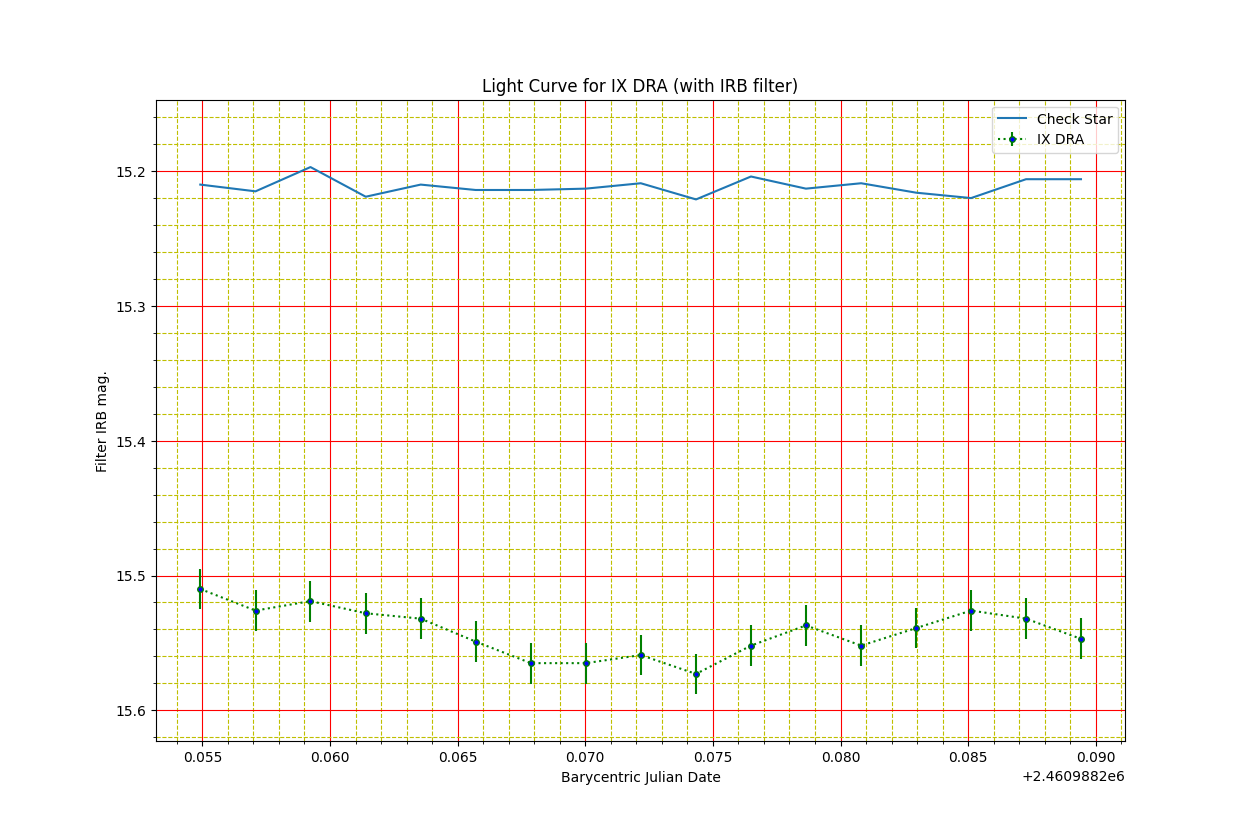
Mr Ian David SharpParticipantHi all,
I got an average of 15.54 CV mag last night (17 exposures). See attached.
Cheers
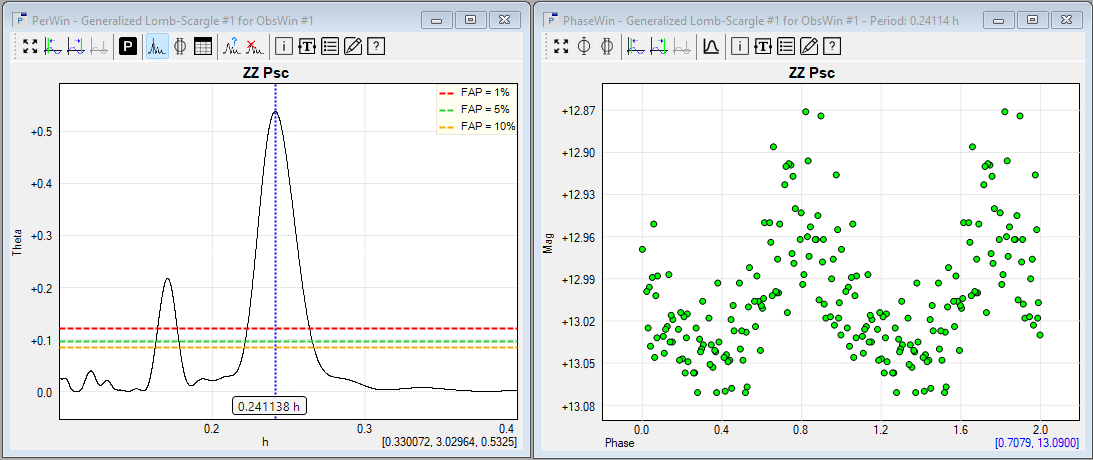
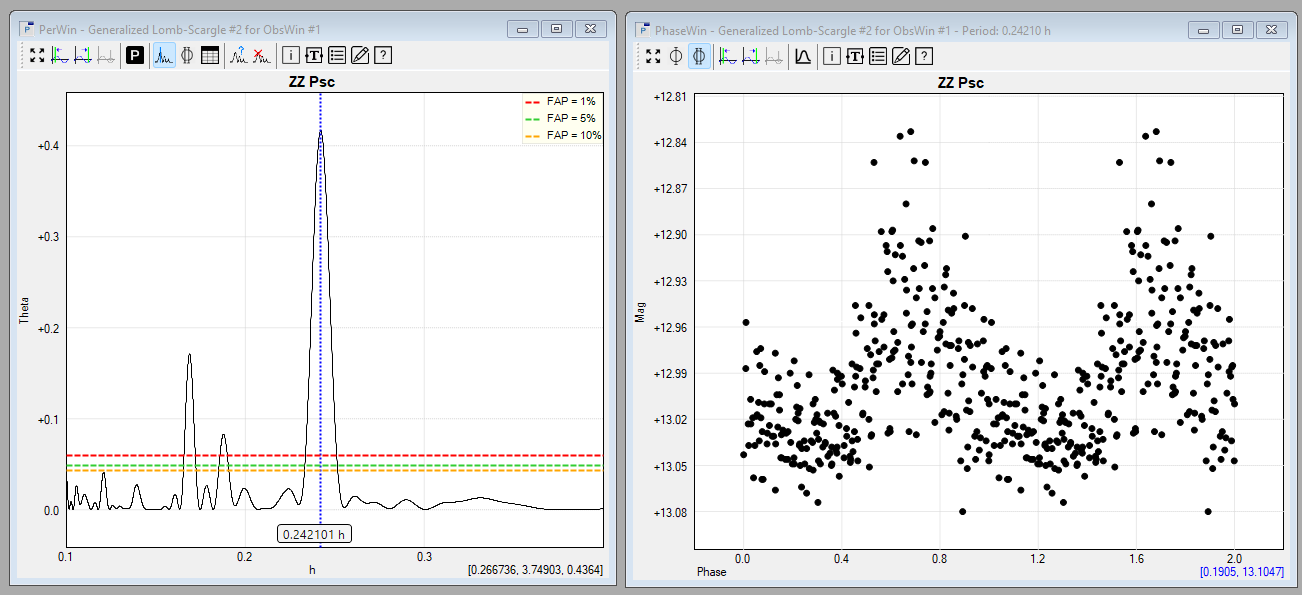
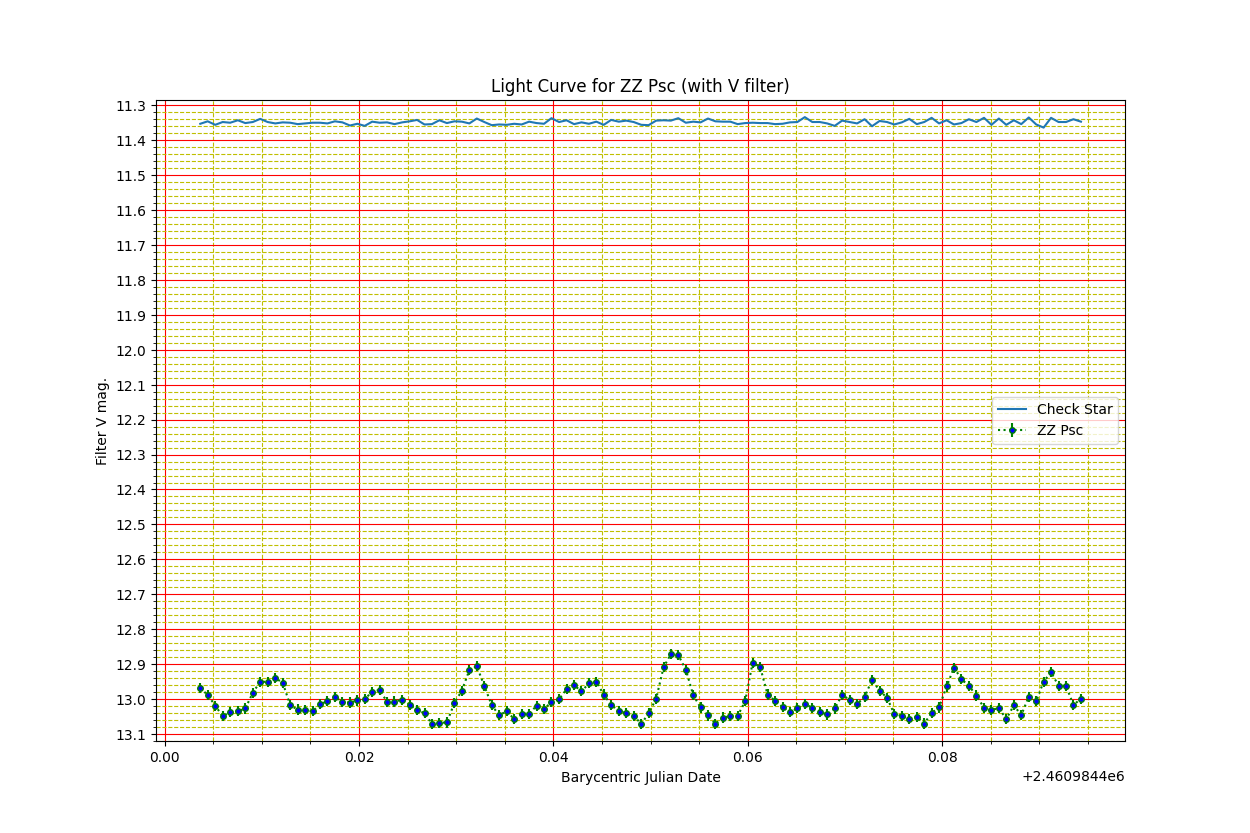
Ian.5 November 2025 at 10:12 am in reply to: Observations of ZZ Psc in support of a JWST campaign #631982Mr Ian David SharpParticipantThat’s excellent, Ian.
Thanks Jeremy,
I captured another run last night and the period was 0.241 hours so it seems to be a real thing. See attached.
Cheers
Ian.-
This reply was modified 7 months, 3 weeks ago by
 Mr Ian David Sharp.
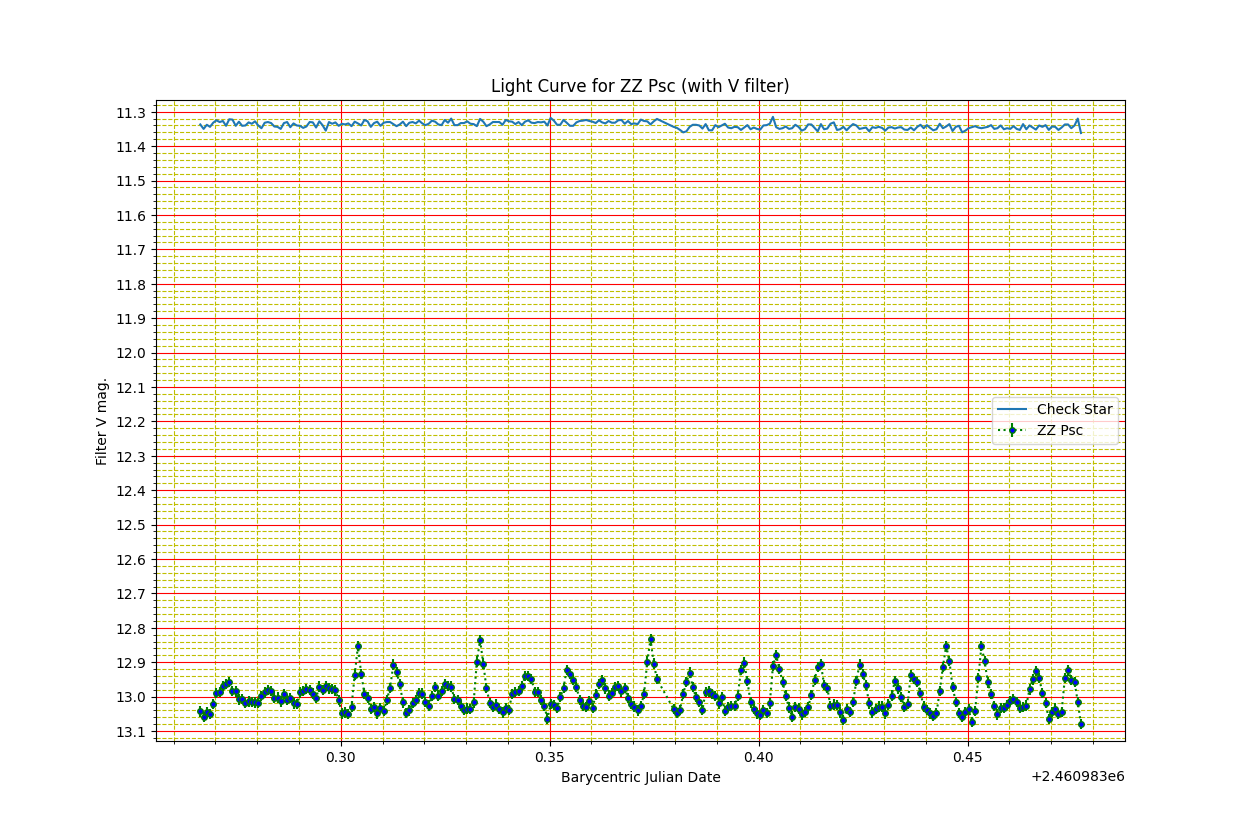
4 November 2025 at 11:05 am in reply to: Observations of ZZ Psc in support of a JWST campaign #631960Mr Ian David SharpParticipantHi all,
I managed a 5 hour run on ZZ Psc from Spain last night (18:15 to 23:20 UTC) and got a nice light curve with 271 points showing pulsations.
I’ve attached the light curve and my Peranso Generalized Lomb-Scargle analysis which shows a strong periodic component at 0.242 hours. I’ve also attached the phase-folded view which looks quite convincing.
Cheers
Ian.1 November 2025 at 1:11 pm in reply to: BAA Amateurs successful in publishing a new paper in the MNRAS #631914Mr Ian David SharpParticipantIt should encourage others to follow suit by publishing in the MNRAS, which does not have page charges and is open-access.
Thanks Richard,
We had to plead poverty to have the charges waived!
Cheers
Ian.31 October 2025 at 2:33 pm in reply to: BAA Amateurs successful in publishing a new paper in the MNRAS #631904Mr Ian David SharpParticipantThe team has done this previously, iirc, and would be welcome to do so again.
Thanks Jeremy,
We would like to do that again…will be in touch.
Ian.
Mr Ian David SharpParticipantVSX gives a period of 90min for V1159 Ori.
Hi Stewart,
Well, I’m not in Spain but my kit is. I’ll try and get a really long run on it to see if I can pick up the period. The weather in Spain is not cooperating!
Cheers
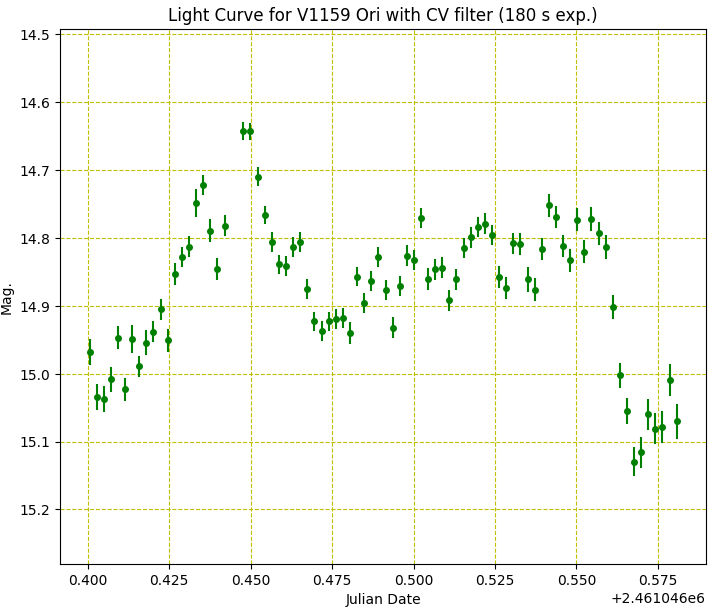
Ian.Mr Ian David SharpParticipantHi all,
Here’s a run I did on V1159 Ori the night before last from my C11 in Spain (2025-10-27). Interesting short term variability. The SNR of the target star was around 100. The average V mag was 14.89 over the 21 frames.
I will carry on monitoring it…
Cheers
Ian.Attachments:
Mr Ian David SharpParticipantThanks Jeremy – a really enjoyable day!
Cheers
IanMr Ian David SharpParticipantHi folks,
I’m looking forward to the meeting tomorrow. I’m staying in the nearby Premier Inn on Saturday night rather than drive straight back to the South Coast afterwards. So, will be available for a beer!
Cheers
Ian.Mr Ian David SharpParticipantHi Paul,
Are you uploading your images to the image gallery? I can’t see your recent images there. That’s the best place for them as you will get them in front of more people and can input all the details etc. Also, you might get selected for a Picture of the Week!
Cheers
Ian.Mr Ian David SharpParticipantI am asking £1000 ono.
Reduced to £800 !
Mr Ian David SharpParticipantExcellent photometry and analysis as ever
Many thanks Tony,
The best paper I can find is this one from 1993 and there does not seem to be a modern analysis as far as I can see.
Photometry of EF Pegasi during Superoutburst
The authors say the following in the abstract:
EF Pegasi was observed photometrically during a superoutburst in 1991 October. Superhumps seen during these observations were best fit with a period of 2h .09. This period is used to determine a likely orbital period of 2h .05 and a mass ratio (M_2/M_1) of 0.26. Distance estimates for EF Peg give values of 250 to 600 pc.
Cheers
Ian. -
AuthorPosts