Forum Replies Created
-
AuthorPosts
-
 Robin LeadbeaterParticipant
Unfortunately hackers trashed the forum some months ago. They have been working to restore it from backups but has been slow going. (I think the messages are intact but I believe it is restoring the links to the embedded images which is giving problems.) I hope it does come back eventually. It is a huge source of information and tracks the history of the developments over a number of years. Suggestions for targets and calls for observations are posted on the connected spectro-l forum though
https://groups.io/g/spectro-l/topicsCheers
RobinRobin LeadbeaterParticipantShouldn’t it possible to extract useful information from the sky background in the photometrically calibrated images and spectra we take ? If so there could already be a huge (untapped ?) historical source of data covering a range of passbands, locations, air mass and atmospheric conditions
Cheers
RobinRobin LeadbeaterParticipantWhat causes the curved dark streak? Is this a region devoid of dust or perhaps a shadow cast from an out of plane dense dust jet ? (There does seem to be a corresponding bright streak to the left which could be the source of the shadow. Would this be consistent with the current geometry relative to the sun ?)
Robin
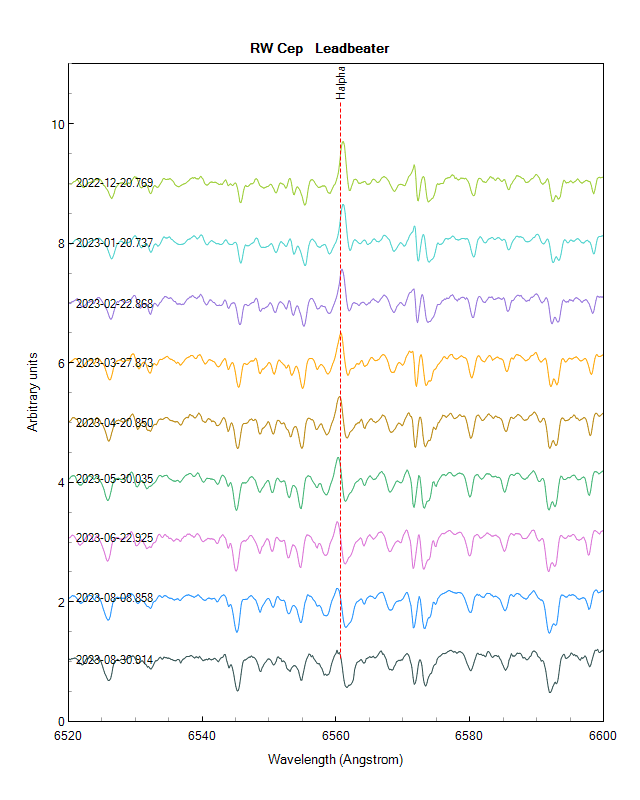
Robin LeadbeaterParticipantInteresting. I took a spectrum on 10th Nov (Getting rather faint for my standard ALPY so now changed to my lower resolution ALPY200) so it will be interesting to see if there are any changes the spectrum. Here are the spectra for the past couple of months (Observing at high air mass now so the continuum slope may be suspect)
Cheers
RobinRobin LeadbeaterParticipantYes that is how gain is usually defined for camera sensors It is slightly perverse because the figure goes down as the conventional gain (how much the signal is amplified) increases !
With CCD sensors the gain is normally fixed, set so the full well depth of the sensor (the point at which the sensor becomes saturated) matches the maximum counts of the ADU.(In this case it would at 5e-/ADU for a 12 bit ADU and FWD of 20k e-) But with CMOS sensors you can increase it which reduces the maximum number of electrons you can count before you reach the maximum of the ADU. Why would you want to do that you may well ask? Well with CMOS the read noise goes down as you increase the gain so in circumstances where you cannot use the full well depth (eg a faint object or you need a short exposure) you can increase the gain and take advantage of the lower read noise.
Cheers
Robin-
This reply was modified 2 years, 8 months ago by
 Robin Leadbeater.
-
This reply was modified 2 years, 8 months ago by Robin Leadbeater.
-
This reply was modified 2 years, 8 months ago by Robin Leadbeater.
Robin LeadbeaterParticipantI’m confused over this.
The counts have been multiplied by 16 to look like 16 bits. You can see the true ADU from the manufacturers charts where a FWD of 20k e- at 5e-/ADU gain gives 4k ADU
https://astronomy-imaging-camera.com/wp-content/uploads/1600-Gain-RN-DR-FW-vs-gain1.jpgRobin
-
This reply was modified 2 years, 8 months ago by Robin Leadbeater. Reason: added extra info on ADU and gain
Robin LeadbeaterParticipantthe consensus of opinion is that what has gone wrong is that copies have escaped from the compostable plastic wrappers in the post, because of the extra weight of the Handbook, and have got lost, or been repackaged and not yet delivered.
Yep, mine arrived split along the seam and it was only luck that prevented the handbook escaping
Robin
Robin LeadbeaterParticipantDoes it mean I should stick with 1X1 or is the camera a poor match for this short FL
Hi Kevin
Keeping in mind that I am only a casual photometrist and perhaps more experienced observers can comment, but my understanding is undersampling (ie less than 2-3 pixels relative to the star image FWHM) can be problematic for photometry. So on that basis I would say you should not bin unless your seeing is worse than 5 arcsec and if your in focus star image under good seeing is smaller than 2.6 arcsec FWHM you might have to consider mitigating measures even when unbinned. The AAVSO manual also discusses this in section 3.2.2 – 3.2.3
Cheers
RobinRobin LeadbeaterParticipantThe C14 is f/11 whereas the C11 is f/10 so for extended objects he is sort of right but only for sensors with the same pixel size.
Even there, since the C14 image will be (more) oversampled, the images could be filtered to match the seeing (which limits the image resolution here) and then other than some extra camera read noise from the larger number of pixels covered, the two images would contain the same information but the C14 would need less exposure time. I could perhaps even argue that with CMOS sensors the increased oversampling with the C14 might give a greater potential for filtering the non stochastic telegraph noise.
Robin LeadbeaterParticipantStellaMira refractor, 90mm ED triplet, FL 600mm
ZWO – AISI 1600MM Pro (cooled) camera
This gives a plate scale of 1.3 arcsec per pixel unbinned so unless your seeing is particularly poor you would be undersampled with 2x binning
Robin LeadbeaterParticipantThere is a chap on Astrobin who considered this same project. In the end he decided that an MX+ would just not cut it, so he bought an MEII see
Hi Martin,
at the risk of opening an oft opened can of worms, the quote there
“Interestingly enough, although the C11 has only 60% of the light gathering area of the C14, it has a focal length of 2.79m compared to 3.91m for the C14. It is therefore faster and that varies with the square of the ratio of the focal lengths. Therefore I will end up with a 20% higher signal with the C11”
Is nonsense yes ? (you would get more signal from any target with the C14. it is then just distributed differently on the sensor)
Cheers
RobinRobin LeadbeaterParticipantHi Jack,
I am intrigued to know what the application is with two similar scopes like this on the same mount pointing at the same target
Cheers
RobinRobin LeadbeaterParticipantYep I am using ANSVR with Windows 10
Robin LeadbeaterParticipantHave I missed a setting somewhere ?
Yep finally found the unticked checkbox. On to the next step…
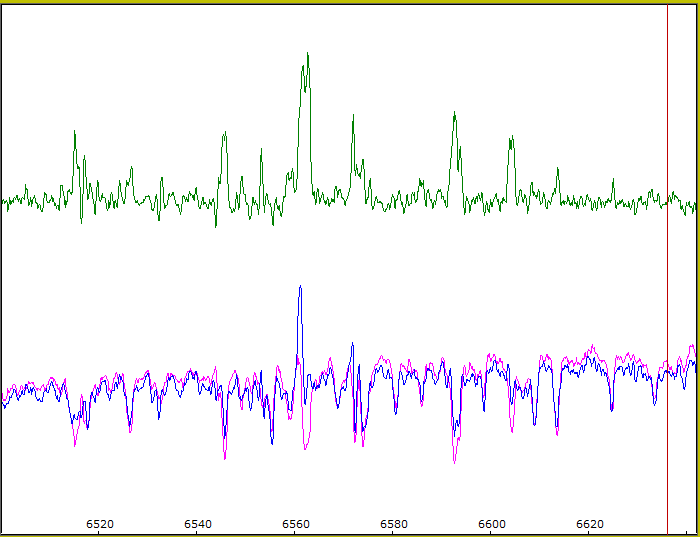
Robin LeadbeaterParticipantThe dimmed spectrum divided by the current spectrum (green)
Attachments:
Robin LeadbeaterParticipantThe H alpha emission I mentioned in the VSSC article on RW Cep (and referenced in the paper) has also reduced in the past 3 months as the brightness increased so it looks like it is associated with the dimming.
Cheers
RobinAttachments:
Robin LeadbeaterParticipantAn interesting article on SN 2023ixf. (Well known supernova expert Prof Alex Filippenko was showing people M101 at a star party 11 hours before discovery but did not spot it !)
https://news.berkeley.edu/2023/08/29/releases-20230828-6895045
(Hat tip to Rigel7 on cloudynights for this)Cheers
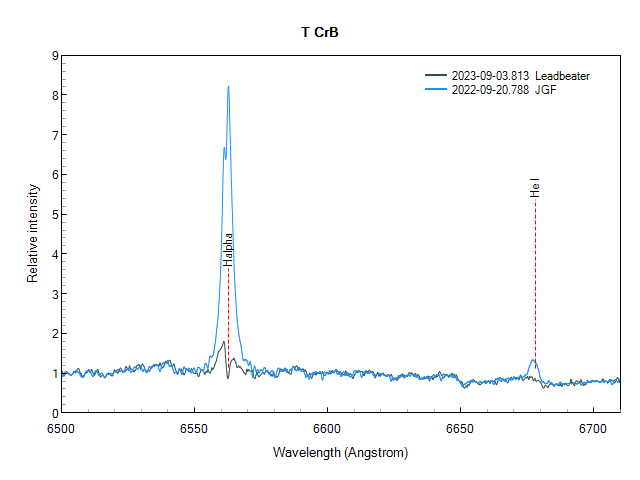
RobinRobin LeadbeaterParticipantThe He 6678 line (which I understand is more sensitive to changes in the inner disc region) has disappeared into the noise in my spectrum
-
This reply was modified 2 years, 10 months ago by Robin Leadbeater. Reason: trying again to attach file
-
This reply was modified 2 years, 10 months ago by Robin Leadbeater.
Attachments:
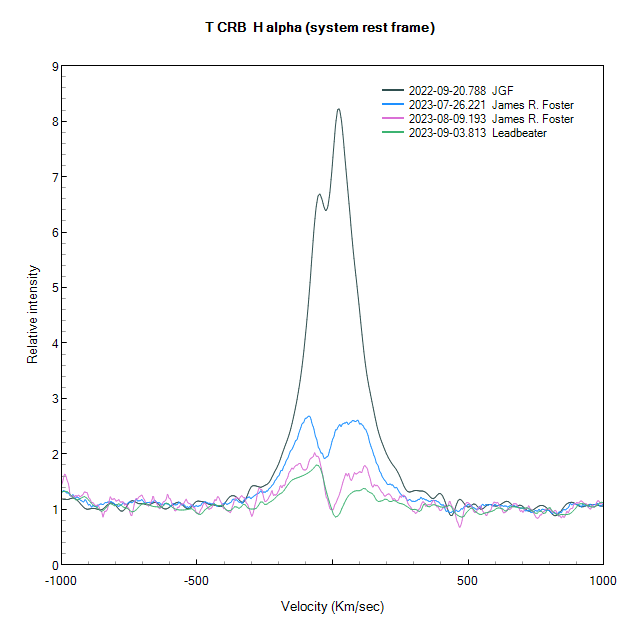
Robin LeadbeaterParticipantI managed to squeeze in a high resolution spectrum last night in twilight before it dipped into some trees. The decreasing Equivalent Width of the H alpha emission line reported in ATel #16214
https://www.astronomerstelegram.org/?read=16214
is confirmed by the spectra in the BAA database.Cheers
RobinAttachments:
Robin LeadbeaterParticipantIf it follows the usual IIP type trend I expect it will now continue in a shallow decline dependent on radioactive decay
Robin
-
This reply was modified 2 years, 8 months ago by
-
AuthorPosts