Forum Replies Created
-
AuthorPosts
-
 Robin LeadbeaterParticipant
Thanks Peter,
Yes if you unset the orientation eg by clicking the icon at the bottom of the image frame it does as you say then display the image but with the original orientation. It is most peculiar as as moving the mouse over the greyed out image to locate the high counts where the stars are does confirm it actually performs the reorientation and you can display the brightness histogram etc but it just refuses to display the image for some reason. I guess there must be something odd about the image that it does not like. It is a pity as my intention was to give it a plate solved spectrograph guider image and overlay it on a DSS/SDSS image to check the position of the slit is correct for objects which are too faint to see in the guider exposures. I will reread the manual and perhaps try some other images.
Cheers
RobinRobin LeadbeaterParticipantHi Peter,
Yes that is what I am doing (also the icon at the foot of the image frame) It appears to work but the image is just greyed out. lets see if I can attach an example
Attachments:
Robin LeadbeaterParticipantHi John,
I would say 8 inch would be enough to break into this game. Claudio Balcon who is now the leading amateur in this area started successfully using a 0.2m aperture with his similar home built 200l/mm grism slit spectrograph, though he uses a larger 0.4m aperture now.
https://www.wis-tns.org/search?&page=1&classifier=Claudio%20Balcon
(The ones before August 2023 are all with the 8 inch)I work down to around mag 17.5 normally but there are quite a few candidates that get to around say mag 15.5-16.5 before being classified which should be within reach provided your skies are not too badly light polluted. An 8 inch at f7 is a similar focal length as my C11 running with as standard 0.63 reducer at f5.5 so if your seeing is similar it should match the same 23um slit I am using.
These are my classifications, most with the ALPY200. I tend to do more follow ups than initial classifications these days but the most recent 2 are official classifications, one at ~mag 17 and another ~mag 15.5 with strong contamination from the galaxy
https://www.wis-tns.org/search?&classifier=leadbeaterYou’ve probably already seen it but I did a Youtube presentation on it for Shelyak when they brought out the commercial version
https://www.youtube.com/watch?v=0L6LLn9HjUY&ab_channel=ShelyakInstrumentsTVCheers
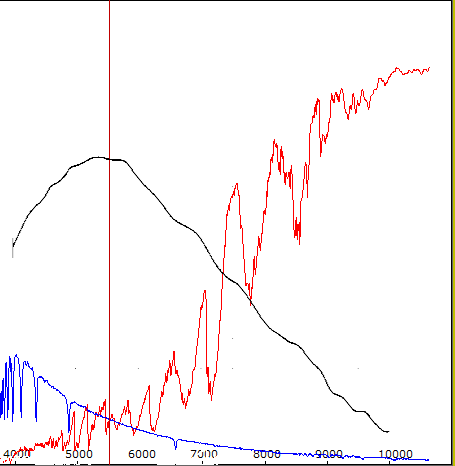
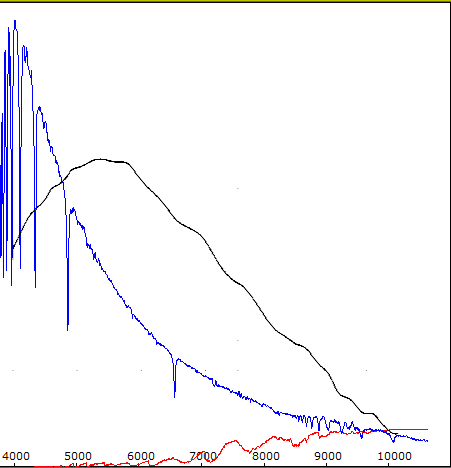
RobinRobin LeadbeaterParticipantHere are typical spectra of M5iii in red (R Lyr) and A0v in blue (Vega) with a typical sensor QE curve (black) overlaid, first at equal V magnitude and then with the correct relative magnitudes assuming RR Lyr Vmag =4.0.
R Lyr is ~ as bright as Vega in the I band but should still look significantly fainter integrated over the response of an unfiltered image. (Unless perhaps close to the horizon where atmospheric extinction would reduce the difference)
Cheers
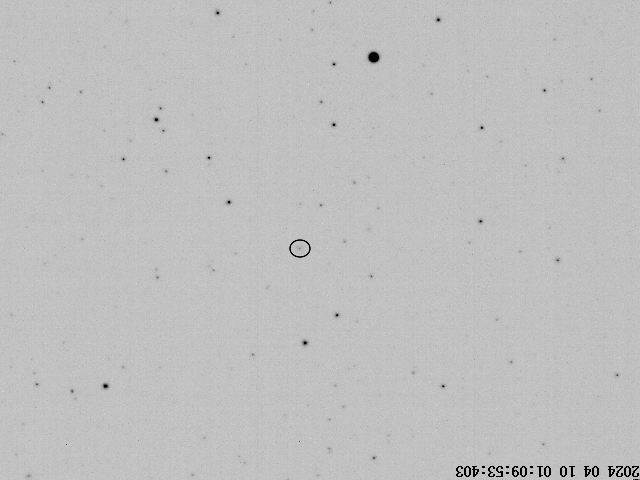
RobinRobin LeadbeaterParticipantHere it is in a 1 sec exposure with my finder last night. (Fuzzy with this unfiltered fast achromat due to the high flux in the IR)
Cheers
RobinAttachments:
Robin LeadbeaterParticipanttoday
tomorrow ! I am often told I dont know what day of the week it is, there is the evidence !
Robin LeadbeaterParticipantAnother bit of eclipse viewing stupidity. Apparently Amazon US are refunding people (using the dealers’ money) who bought SeestarS50 smart scopes because it might be dangerous to view the sun through it as the solar filter does not comply with the AAS filter advice !
https://www.cloudynights.com/topic/917434-seestar-warning-email/Hope you have clear skies today over there
Robin LeadbeaterParticipantHi John,
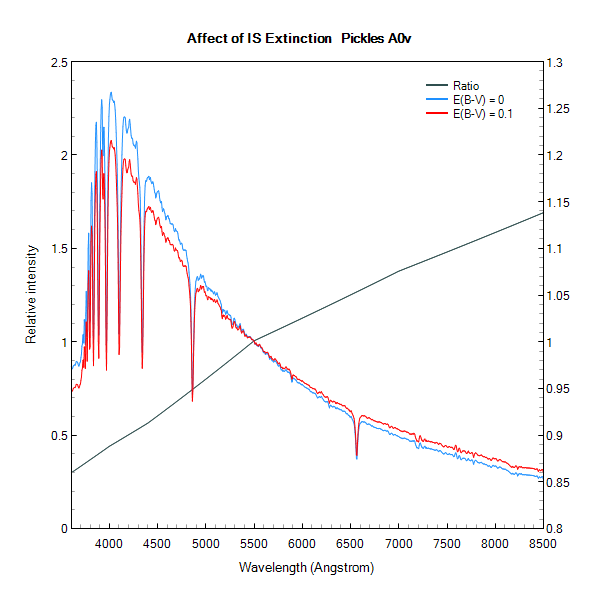
This applies when using a standard star spectra eg Pickles in place of an actual measured spectrum and assuming the published spectral type is correct. It depends how accurate you need to be, particularly at the violet end. Francois Teyssier’s Reference Star Finder spreadsheet default setting gives a warning for stars with E(B-V) >0.05 and an alarm >0.1. If you have ISIS you can estimate how much effect it has using the extinction tool on an A0v Pickles spectrum for example. Attached is the error with E(B-V) = 0.1. I suppose you could even correct for the effect, though that is perhaps pushing the use of stars with published classifications but no published spectra a bit far
If you have a star with a known as measured spectrum like the non dereddened MILES stars for example the extinction does not matter in theory of course, though I would avoid using the MILES stars with very high extinction. Although it was I who first advocated the use of MILES stars back in 2011,
http://www.spectro-aras.com/forum/viewtopic.php?f=8&t=191
I have fallen a bit out of love with them as only a few are ideal as reference stars as many are potentially variable.An alternative is the larger MELCHIORS set of spectra which are at much higher resolution so could also be used with higher resolution spectrographs like the LHIRES for example.
https://www.royer.se/melchiors.html
SpecInti software has a script in its toolbox for extracting them in a form readable by the usual software (note there is a typo, a missing _ in the English version of the script)
http://www.astrosurf.com/buil/specinti2/specINTI_toolbox2_en.pdf
and the STAROS campaign website also has an on line extraction tool
https://search.staros-projects.org/Cheers
RobinAttachments:
Robin LeadbeaterParticipantBrad Schaefer talking enthusiastically about T CrB on BBC World Service “Science In Action”
https://www.bbc.co.uk/sounds/play/w3ct4sdvRobin
Robin LeadbeaterParticipantSpectra from 2SPOT and Tom Love now posted in the ARAS forum
http://www.spectro-aras.com/forum/viewtopic.php?p=17753Robin LeadbeaterParticipantA spectrum from 2024-03-12 by the 2SPOT team (amateur remote echelle spectrograph in Chile)
http://www.spectro-aras.com/forum/viewtopic.php?t=3122Very red continuum with very intense, very broad H alpha
Robin LeadbeaterParticipantI have released the collar. When tightened then slackened a fraction of a turn the micrometer is easier to turn.
Then I think you have found the cause of the problem. You can slacken it right off. If it turns freely then, there is no overhaul needed. I find the micrometer setting does not move on its own in normal use but if you want to be 100% sure you can always clamp the locking collar back down after you set it at the wavelength you chose. No need to lock it with the grub screw though. That is really for use in an industrial machinery where the micrometer might be used as a set stop which must stay in position under vibration etc
Robin LeadbeaterParticipantIf the locking collar is engaged and you have the locking screw loosened, it could be worth trying to release it first. (Screw anticlockwise) I just tried mine and when the collar is engaged it can be quite tight to then disengage. Try it with your spare, engaging and disengaging the locking collar does not affect the calibration.
Re lubricant the internet suggests clock oil for micrometers. (not silicone which creeps and could end up on the optics)
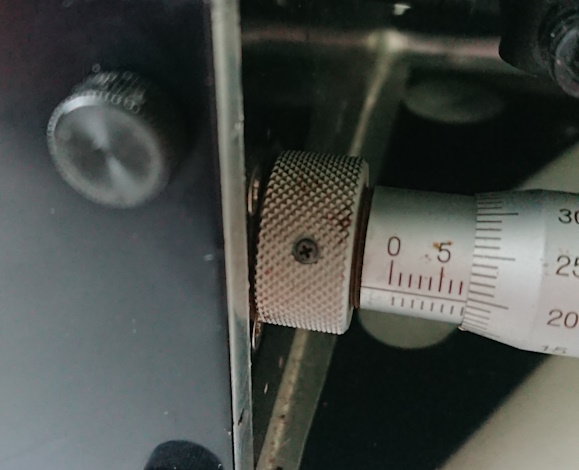
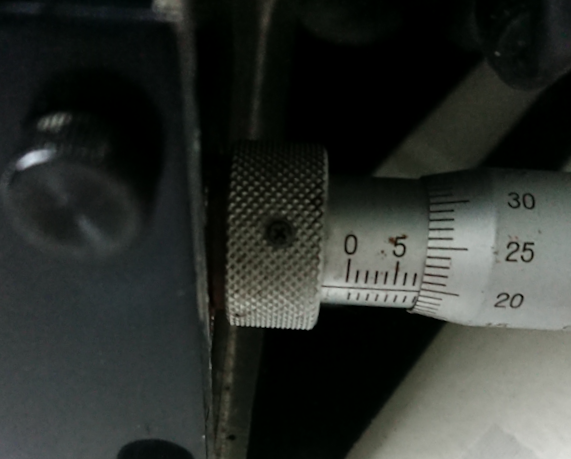
Robin LeadbeaterParticipantIf the grub screw was not loose and the locking collar cannot be turned even after loosening the screw it is unlikely that this is the reason that the micrometer had become tight. (Did it suddenly become tight or has it becoming increasingly tight over time). Can you tell from my photos and comparing with the other LHIRES if the collar is engaged or disengaged ?
Other than that I guess it needs an overhaul, removing it, unscrewing the barrel cleaning and re-lubricating. Mine is still fine after 18 years though (I recall you have a remote adjustment, could this have been preloading it causing premature wear?)
Robin LeadbeaterParticipantPhotos with the collar engaged and disengaged
Robin LeadbeaterParticipantI just used a Jeweller’s screwdriver but if the grub screw is tight then it seems unlikely that the collar has moved so it probably is not the reason for the micrometer becoming tight. With mine the locking collar is close to the spectrograph body when engaged and there is a definite gap with it disengaged. I will take a couple of photos.
Cheers
RobinRobin LeadbeaterParticipantThere is a knurled collar at the base of the micrometer held in position with a tiny cross head grub screw which is used to lock the micrometer at a given setting. Has that got tightened down? Mine is fully wound off (anticlockwise) and locked down with the grub screw.
Cheers
RobinRobin LeadbeaterParticipantMeanwhile ZTF have “discovered” their second high proper motion star in the past 3 months
https://www.wis-tns.org/object/2023acmv
https://www.wis-tns.org/object/2024dumRobin
28 February 2024 at 1:42 am in reply to: Request for observations of the nearby supernova SN 2024cld #621881Robin LeadbeaterParticipantThat’s odd. According to time on the confirming spectrum on TNS, it was taken a day before the discovery date
Robin
Followed this up with the GOTO team. The date of the spectrum was indeed wrong and is now corrected in TNS
Robin
23 February 2024 at 7:39 pm in reply to: Request for observations of the nearby supernova SN 2024cld #621842Robin LeadbeaterParticipantThat’s odd. According to time on the confirming spectrum on TNS, it was taken a day before the discovery date
Robin
-
AuthorPosts