Forum Replies Created
-
AuthorPosts
-
 Andy WilsonKeymaster
Hi John,
Those are good looking spectra. I don’t have a detailed knowledge of Nova spectra, so I am glad to see that Robin has provided some useful information and links.
I suspect your response correction is working reasonably well, but it is difficult to tell how good it is with an evolving spectrum like that of a Nova. A good way to check is to take spectra of a couple of standard stars, like ones with Miles spectra. Use one of them to create the response correction, then apply it to the other star and see how close it is to the Miles spectrum. Noting these are the versions of the Miles spectra which have not been dereddened. You will also need to choose stars and times to give similar altitude when obtaining the spectra, so the effects of the Earth’s atmosphere are similar.
I am glad you found the BASS tutorial useful. I have a feeling I did not include normalising the spectrum to unity over a selected wavelength range that tries to avoid any significant spectral lines. This helps with comparisons and is a standard approach when submitting spectra to a database or campaign. When comparing spectra on a plot I then either overly them or artificially apply an offset in BASS in order to see details and changes.
Great to see you are already getting excellent results from your Alpy.
Best wishes,
Andy
Andy WilsonKeymasterHi John,
First of all welcome to the spectroscopy. There can be a steep learning curve at the beginning, but you are on the track and it does get easier. Once you get the hang of it then it is very rewarding, adding a whole new level to the hobby.
I wrote a BAA tutorial on using BASS with the Alpy, which can be accessed here:
https://britastro.org/downloads/10412
In section 5 on page 23 I go through calibration, covering off many of the things you have found, like a cubic fit being a good compromise. I think the strength of lines can vary from calibration lamp to calibration lamp. In the tutorial I include plots/images of calibration lamps with the lines identified from 3 different sources, which may help in the identification. I found the following 6 lines worked well, though you may find a different set works best for you.
4200.67 Ar
4764.87 Ar
5852.49 Ne
6562.85 Hα
6965.43 Ar
7272.94 ArBASS is very user friendly and easy to get going with, while ISIS is great at processing spectra quickly with less intervention but it has a steeper learning curve and you have to get everything setup just right. There is also DEMETRA from Shelyak, which I have not used but I understand it was created for the Alpy and should also make processing spectra more straight forward.
Best wishes,
Andy
Andy WilsonKeymasterInteresting question.
I agree, a lot of units in astronomy are a bit crazy, but I do find arcseconds are a very useful size. They are close in size to typical seeing conditions, and a small number can be used to describe the size of planets and many other celestial objects.
Arcseconds are also quite handy when dealing with distances measured by parallax, like by the Gaia mission, as they are used to define the distance in parsecs. The distance in parsecs is defined as one divided by the parallax in arcseconds.
Cheers,
Andy
Andy WilsonKeymasterVery exciting times Alex. The data will revolutionise many fields of astronomy. I was just starting to use the data to analyse star forming regions when an unfortunately timed computer failure stopped me.
Andy
Andy WilsonKeymasterThe online resources of SIMBAD and Aladin can be very useful for investigations.
http://simbad.u-strasbg.fr/simbad/
http://aladin.u-strasbg.fr/aladin.gml
Here is M108 in Aladin Lite displaying an SDSS9 image with 2MASS point sources:
Cheers,
Andy
Andy WilsonKeymasterHi Roger,
I must admit to being pleasantly surprised by the number of BAA members already involved with exoplanet observations. So I agree this does appear to be the right time for a new Section.
Best wishes,
Andy
Andy WilsonKeymasterHi Adam,
On this ocassion I think it is a foreground star. I’ve found some old images which show the bright star at that position.
http://www.astrocruise.com/galaxies/m108.htm
http://www.astrosurf.com/jwisn/m108.htm
Though this bright star near the centre is not always so obvious as can be seen from Graham Winstanley’s image.
https://britastro.org/node/10192
It might be that it is a variable star, or possibly a very red star that shows up more prominently in some images than others depending on filters and equipment sensitivity. I’ve tried to identify the star to confirm its nature, but no luck.
Good call though as it is always a good idea to check images for the unexpected.
Cheers,
Andy
Andy WilsonKeymasterHi Roger,
That is an interesting idea. It also occurs to me whether exoplanets might be a good fit within the Variable Star Section? I’m not sure if this is a controversial idea, perhaps as a ‘subsection’? I suggest this as the techniques are the same, since exoplanets are detected via their influence on their host star, causing it to vary in magnitude or radial velocity. As I understand it, amateurs have been able to detect previously discovered exoplanets via both the transit and radial velocity methods, though I think only a handful are within reach of amateur equipment. If there is a new Section, then I think it would be good to have close ties with the Variable Star Section.
Perhaps there are members who have or are actively making observations of exoplanets who could make their views known? Though you may have been in touch with these members.
It is a topic that captures the imagination, so I can see the benefits of the BAA establishing some kind of presence.
Best wishes,
AndyAndy WilsonKeymasterGood spot Robin. I’ve edited the link so the full stop is not part of it. I’m sure David won’t mind.
Andy
BAA Web Content Editor
Andy WilsonKeymasterJust to note that BASS stands for Basic Astronomical Spectroscopy Software, written by John Paraskeva, and though it started out ‘basic’ it is now much more advanced. You might get some responses, but I think John setup that Yahoo group for his BASS software rather than VSpec. If you don’t get a response from the BASS group then one of the more general spectroscopy groups might be better like Ken Harrison’s Astronomical Specotroscopy group.
https://groups.yahoo.com/neo/groups/astronomical_spectroscopy/info
Though I’ve used VSpec, I am not very familiar with it. It is very versatile and powerful, but I found it would crash on me without warning and I’d loose my work.
Cheers,
Andy
Andy WilsonKeymasterHi Jack,
I’ve seen both of what you describe.
I found that depending of the angle of the spectrograph due to gravity, then there can be small wavelength shifts. Nothing to cause a serious problem during normal observing, though on a run lasting over an hour might then the overall resolution could be slightly reduced. The tests I did were about 3 years ago and I’m not sure I’ve still got a copy. With the spectrograph off the telescope I took neon calibration images with the spectrograph on each side and vertical, to observe the most extreme effects. I then made careful measurements of the centres of the neon lines at the same position on each image.
It might be worth making sure all the screws in the body of the LHIRES III are tight, but I think small shifts are to be expected. There is more than one moving part and heavy cameras attached. Only a minute flexure will cause a small shift in wavelength. That is one reason why fibre fed spectrographs can be more stable, though using optical fibres introduces a different set of problems.
I also see shifts in focus with temperature. So on a cold night if I start with the neon lines in perfect focus then often they won’t be in perfect focus at the end of the run. This is again something I live with. The flat fields will be slightly compromised, but if I refocus then that would also compromise the flat fields. Of course as long as you retake the flats after each refocus then that is not a problem. This is the same behaviour as needing to refocus a telescope due to thermal contraction from falling temperatures.
Best wishes,
Andy
Andy WilsonKeymasterHi Peter,
As Robin has pointed out, there may be a very easy fix to the ripples, which is simply to orient things such that the spectrum falls along the camera chip length ways.
Cheers,
Andy
Andy WilsonKeymasterHi Peter,
It looks like you are off to a good start. The hydrogen Balmer lines are clearly visible so everything must be working. I note there is a bit of a wiggle in the spectrum from about 5300 to 5900 Angstroms. From the regularity in the spacing I wonder if this might be an interference effect that I have heard of with some cameras. There could be a hint of it at other wavelengths too.
Cheers,
Andy
Andy WilsonKeymasterHi Dave,
I can give some insight into the variable star observations and spectra, as I manage those BAA databases.
BAA Variable Star Section Database: http://britastro.org/vssdb/
BAA Spectroscopy Database: http://britastro.org/specdb/
It used to be that amateurs and professionals would request this type of data by contacting the Section Director, and this still sometimes happens. However, it is now far more common for them to simply download the observations from the website. We have notes on the database websites asking researchers to acknowledge the use of the data.
We also send a copy of all our variable star observations to the AAVSO once per quarter. While researchers will often come to the BAA databases, some researchers may only look at the AAVSO website, in which case sharing our observations makes them more widely available and useful. The AAVSO acts as a bit of a central hub for variable star observations, receiving observations from a number of global organisations. The AAVSO acknowledge the individual organisations as well as the observer in the data. It is important to note that the AAVSO database does not store all of the information that is held by the BAA Variable Star Section database. In particular we additionally record the chart and comparison stars, so that light curves can be updated when more reliable comparison star magnitudes become available. Something which has happened many times over the decades, and otherwise causes unreal bumps and dips in the light curves.
The BAA Spectroscopy Database is relatively speaking quite new, though I already see it referred to amongst the spectroscopy community. With time it will become better known, as observers refer to it in their communications, and interested researchers are pointed to it. There has been an example of this in the past month with a Pro/Am project looking for a place to archive historic spectra, so they can be made available to researchers for download.
There are also a good number of dedicated campaigns to observe particular targets. Though I primarily make variable star and spectroscopy observations, I see these going on for solar system targets as well. Those involved in these campaigns will usually have an understanding of how their data is being used.
Best wishes,
Andy
17 February 2018 at 12:34 pm in reply to: First Spectroscope finished… (well, mechanically). #579129Andy WilsonKeymasterHi Tony,
That is a nice looking spectrograph, and at least being orange you are less likely to bump your head on it in the dark. It sounds like things are progressing well and I’ll be interested to see the results once it is operational.
Best wishes,
Andy
Andy WilsonKeymasterHi again Jeremy,
The BAA does hold meetings in Wales, but I don’t think there are any coming up in the near future. Anyone please correct me if I have missed any! I am not sure they are particularly frequent but I’ve been to at least 3 meetings in Cardiff.
Not in Wales, but just across the Bristol Channel is a Back to Basics Workshop at Bristol on 10th March.
https://britastro.org/Bristol2018
Best wishes,
Andy
Andy WilsonKeymasterWelcome to the BAA Jeremy!
The Sky-Watcher ESPRIT are good scopes so there is plenty of interesting observing available to you. Though I am sure you are aware of that from your prior time in the hobby. Joining Observing Sections is a great way to become involved and meet fellow enthusiasts. That is certainly the area that I find most rewarding.
Best wishes,
Andy
Andy WilsonKeymasterHi Tim,
Thanks for the suggestion. The Website Operations Team will take a look at the feasibility, so I won’t say a yes or no at this stage. I can see the benefits.
Best wishes,
Andy
Andy WilsonKeymasterHi Jack,
I use an ecoair DD122 Classic Mk5. I got it a few years ago from an online retailer but I cannot remember who. As Peter says it is import to get desiccant based dehumidifier so it will work in cold temperatures. Here are a couple of pictures.
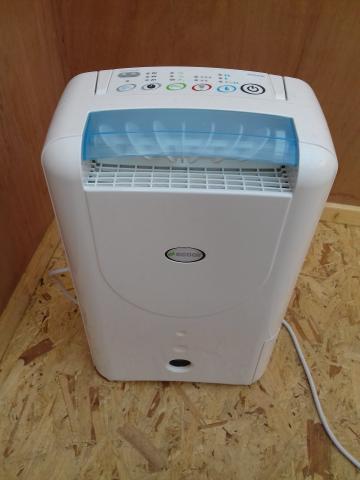
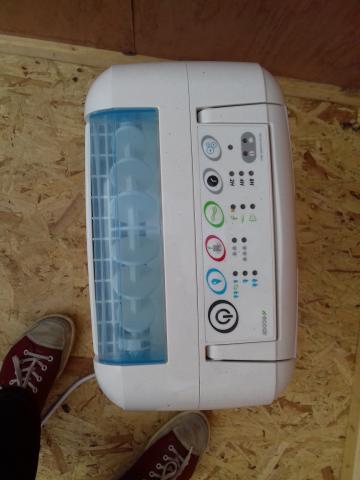
I also run a 60W tube heater near my computer to avoid condensation causing problems with it.
Best wishes,
Andy
Andy WilsonKeymasterHi Nick,
I have a dehumidifier that I run in my observatory for a couple of hours after each observing session. I find this does a good job of removing the moisture that builds up on surfaces in the observatory. Important to note that you would need a low temperature dehumidifier as there are some which only work at room temperature.
Andy
-
AuthorPosts