Forum Replies Created
-
AuthorPosts
-
 Andy WilsonKeymaster
That is a nice spectrum of Alioth on your member page, showing the hydrogen absorption lines.
Stacking is useful for fainter targets to increase the signal. However, you need good tracking for it to work well with a star analyser, to avoid any drift of the star. If there is even a slight drift then this can blur the spectrum, which might be what you were seeing. One way to reduce the problem is to align the wavelength axis of the spectrum North South, on the assumption that any drift will be East West. This could even help by spreading the spectrum over a few pixels, but requires that you have no drift in the North South direction.
Sharpening should normally be avoided. The algorithms can introduce artefacts and change the line profiles. I have heard of it occasionally being used to bring out faint lines, but it is very risky and will invalidate most of the scientific data contained within the spectrum.
Cheers
Andy
Andy WilsonKeymasterHi Jack,
I’m not sure of the make of my flip mirror as I bought it a few years ago and it is a generic one without a company logo.
There won’t be any side to side adjustments with flip mirrors, or up and down for that matter. They are designed so the light either goes straight through or is diverted up at a right angle. If you are using this in a finder setup then you would normally mount it within finder rings with screws to hold and adjust the finder scope position.
Flip mirrors aren’t usually used in finders. Instead you use them in the light path of your main scope so you can view with an eyepiece or another camera without have to detach your main equipment. Nothing wrong with using them in a finder, but there may not be any benefit to doing so.
Best wishes,
Andy
Andy WilsonKeymasterHi David,
You have already received some great advice for getting started with the links posted by Andrew and Robin. I started out by reading books on the subject, but there is no one book that I would recommend as the best starting point. I can always recommend a few, but you may be able to get all you need from the internet to get going without having to spend money on books.
Starting off with a nice easy target like Vega is definitely the right way to go. I found it took me a few months to learn how to use my setup and get comfortable with the processing, but I was still able to get some pleasing results right from the start. The star analyser is an excellent way to learn. As well as being simple it will also allow you to go fainter than with higher resolution spectrographs, so there are a whole range of targets you can observe.
Good luck and please keep us posted on how you get on.
Andy
Andy WilsonKeymasterHi Alun,
Sounds great. It would be very nice to have it fully remotely controllable. Good luck with your modifications.
Andy
Andy WilsonKeymasterHi Andrew,
Thanks for posting your results. You have the same camera as me, so it is interesting to see your results.
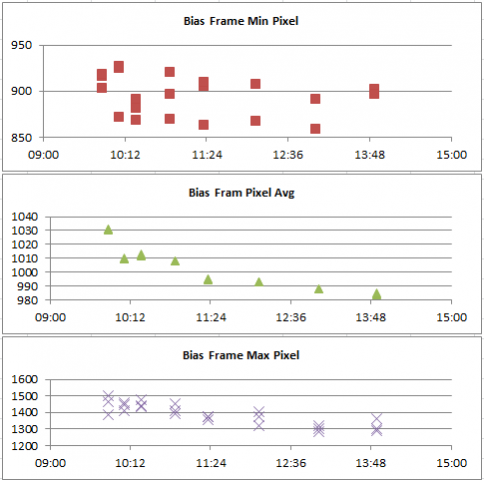
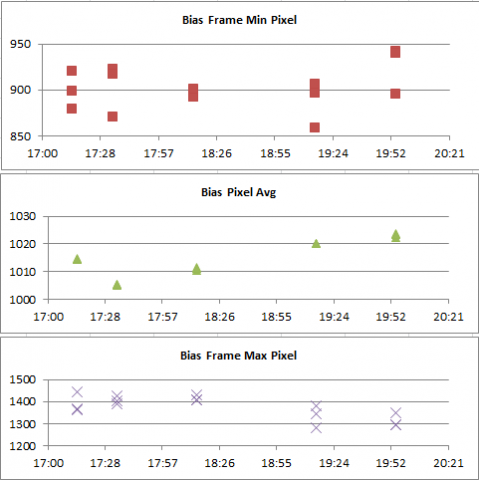
It is a while since I ran my test, and I don’t think I removed the hot pixels, so it is possible they are the cause of what I saw. I really wanted to measure the median pixel value, but the software I was using did not calculate that statistic. So I measured the max, min and average pixel values. Leaving the camera be, and then running a series of bias and dark frames. I must redo it sometime, this time removing the hot pixels.
Here are my results for reference.
Test Run 1
Test Run 2
Cheers,
Andy
Andy WilsonKeymasterThat is an interesting test Andrew, a great demonstration of just how small the dark current is with these modern CCDs. Can you remind me which camera you use?
Also, have you also looked to see if there is any bias drift? That is the one thing that surprised and horrified me when I ran some tests on my camera last year.
Cheers,
Andy
Andy WilsonKeymasterHi Alun,
That is a nice bit of remote control for your neon and flat field lamps. I did give it a bit of consideration, but found I don’t really need it at present. I am at the telescope when I change target, and everything is sufficiently solid that nothing moves when I flick the switches on the spectrograph. This would be great for remote observing!
Andy
Andy WilsonKeymasterHi Denis,
Here is a summary of the results for the successful candidates in 2017.
President: Callum Potter 290
Treasurer: Geoff King 285
Business Secretary: Bill Tarver 280
Papers Secretary: Jeremy Shears 285
Meetings Secretary: Hazel Collett 283
Trustees:
- A Lorrain 228
- D Arditti 209
- J McClean 184
- R McKim 182
- J Chuter 159
Council:
- P Bosley 135
- S Bosley 119
- P Abel 230
- P Carson 162
- R Sargent 158
Total Votes Counted: 320
Null/Void votes:13
Votes not Counted as not renewed or not members: 29
Best wishes,
Andy
Andy WilsonKeymasterHi Denis,
The results will appear in the report of the AGM in the February Journal. I am seeing if I can get hold of a copy to add to this forum thread.
Thanks for pointing out the ‘Who’s who’ Peter.
Best wishes,
Andy
Andy WilsonKeymasterHi Ron,
I also own a 10″ Altair Astro (GSO) RC. I understand that Altair made some kind of modification to the GSO RCs before selling them. I think it was something to do with the mirror cell but I don’t know exactly what. They have stopped selling them now.
I’ve done collimation once and it was a bit of an ordeal. I expect it is one of those things that once you have done it a few times then it gets much easier. I’ve found it to be very stable and appears to hold collimation well. Though as I am also using it for spectroscopy, I don’t worry too much about having the collimation absolutely spot on as this won’t affect the spectrograph resolution, just the throughput and so SNR.
I also upgraded to the Feathertouch Focuser and found it to be rock solid. I’ve not bothered with a motorised focus as I am in the observatory and I can tweak the focus if needed. Though I find the whole telescope and focuser to be extremely stable and so I rarely need to adjust it, except due to seasonal temperature changes.
If you get a 16″ then I’ll be very interested to hear how you get on with it. I wonder about one day upgrading to a larger GSO RC. Though for me the choice was also about a compromise between matching the focal ratio with my LHIRES III spectrograph, and keeping the focal length short so that I have a reasonable field of view in the guide camera.
Best wishes,
Andy
Andy WilsonKeymasterHi Colin,
The shop has now been updated so you can order 2016 and 2017 Journals.
Apologies for the delay.
Andy
Andy WilsonKeymasterHi Colin,
I am very sorry that no-one has contacted you. Normally someone would respond within a few days at the most and so for some reason I don’t think your message could have been received. If everything works as it should then you should automatically receive a confirmation email from the website.
I will check the stock availability of the Journals and then get the shop selection updated. I’ll let you know when this is done.
It is also worth knowing that when you are logged in you have online access to the entire Journal archive. Journals from recent years can be viewed from the Publications -> Journals menu. The full archive of all Journals in pdf form can be access from Publications -> Downloads -> Journals Archive.
Best wishes,
Andy Wilson
BAA Systems Administrator and Web Content Editor
Andy WilsonKeymasterHi John,
I’ve also had this problem. I found that not only the mounting, but also the focuser and mirror flop caused problems. I’m not sure whether you have an extra focuser for fine focusing your C8. I used a Crayford focuser on a 14″ Meade for fine focus without moving the mirror. The weight of the spectrograph and 2 cameras caused the focus tube to shift as I slewed, making it nearly impossible to point accurately.
I am using a different setup now (10″ F8 RC) but I found several points that could help you, 2 already mentioned by Andrew and David.
– If you can afford to setup an electronic finder scope then that can be a big help. Otherwise just a good finder so you can easily and accurately point your telescope to bright stars.
– Star hopping from nearby bright stars. Start off with an obvious bright star on which to sync your telescope. Then jump to bright but progressively fainter stars nearer your target, re-syncing your telescope on each star, until you reach your target.
– I used a flip mirror between the spectrograph and telescope so I could use an eyepiece to check where the telescope was pointing. I found this was a big help but not without its difficulties. I could just about get it so the spectrograph and eyepiece were in focus at the same time. A couple of things to bare in mind. First, this moves the spectrograph and cameras further from the back of the telescope, increasing the moment arm on the telescope and mounting. Second, if you use a Crayford or Rack and Pinion focuser for fine focus then this increases the strain on the focuser.
I would expect finding objects to be much easier with your 80mm refractor as the field of view will be larger. As long as the focuser and mounting are up to the job.
Cheers,
Andy
Andy WilsonKeymasterHi Andrew,
I’ve also been automating equivalent width calculations recently. I suspect you will take a different approach to me, but I thought I’d share my experience.
I am trying to measure the EW of lots of lines in lots of spectra automatically. I’ve not gone down the path of fitting polynomials or Gaussians. Instead:
- Work out the local continuum.
- Sum up the flux from the spectrum between 2 predetermined wavelengths for the start and end of the line.
- Calculate a dummy flux based on my local continuum level between the 2 wavelengths.
- Calculate my absorption flux by subtracting the summed flux from my dummy flux
- Finally calculate a width based on this absorption flux and the height of my local continuum.
As in the other posts, I also find working out the local continuum level to be the tricky bit. To deal with varying levels of noise, I take the median continuum of a few wavelength bins either side of my start and end line wavelength, then take the average of the continuum at my start and end wavelengths.
That is an interesting paper, I’ll have to give it a read.
Cheers,
Andy
Andy WilsonKeymasterHi Peter,
I think you are using a slitless Star Analyser, in which case I wonder if small tracking errors could be the cause. If the star moves or gradually drifts, then so would the spectrum and that would blur the final stacked spectrum. It does appear that the star at the zero order position just below 50 pixels in your first plot is located at a slightly different position between the stack and the single image.
Another check you can do is to compare the first and last image in the stack, or a selection of images in the stack.
I think there are several ways to align individual spectrum images before combining them in a final spectrum, either pre or post extracting the spectrum from the image, though I’ve never done this myself. That could potentially be used to fix tracking errors after the event. Though in general the better the tracking the better the results.
Cheers,
Andy
Andy WilsonKeymasterThat is a major accomplishment Andrew! To both build an echelle spectrograph as well as create the processing pipeline. I look forward to seeing your future results with this impressive instrument.
Andy
Andy WilsonKeymasterLooks fantastic Tony! Ready in time for the long Winter nights. All we need now is plenty of clear skies.
Cheers,
Andy
Andy WilsonKeymasterIt is worth noting that all the spectroscopy software packages I have used do sky background subtraction. It is one of the standard processing steps when you usually select regions above and below the spectrum.
Andy WilsonKeymasterHi Peter,
Nice you are starting to get results. You can pick out the strong hydrogen absorption lines of this A-type star, from right to left H-alpha, H-beta and H-gamma are clearly visible with a hint of H-delta at about 4100 Angstroms. You also have an atmospheric telluric band just short of 6900 Angstroms.
Best wishes,
Andy
Andy WilsonKeymasterHi Alun,
That is a nice set of results showing different H-alpha profiles.
While Vega has a very simple spectrum, I do like it as it is such a great illustration of the luminosity class, which in the case of Vega is a V for dwarf. As the star has a smaller radius, so the surface pressure is higher, leading to pressure broadening of the spectral lines.
Once you get used to doing darks and flats then you will find them a doddle. Particularly with the Lhires III inbuilt flat lamp.
Cheers,
Andy
-
AuthorPosts