Forum Replies Created
-
AuthorPosts
-
 Andy WilsonKeymaster
Thanks for pointing that out Robin, I have now removed it. I suspect it was an accident made by the person who created the meeting.
 Andy WilsonKeymaster
No problem John. This is just a preference and I have seen some people who do post the same item to more than one forum. Personally I find that harder to follow as then you have to check 2 threads for updates.
 Andy WilsonKeymaster
It is always a little tricky when a topic can cover more than one forum category.
I tend not to look at the individual forums unless I am looking for a historic post. Instead I look at the lower right hand side of the web pages, where the 4 threads with the most recent activity are shown. To look back further I click on ‘See more’ as this takes you to a full list of forum posts in descending date order. That way I can be sure I don’t miss anything.
Cheers,
Andy
 Andy WilsonKeymaster
Hi John,
I have a 5 year old Starlight Xpress SXVR-H694. This uses the same chip as your Atik 460 Ex and I still have my dark frames from when it was new. Here are a few screenshots for comparison, noting these are 2×2 and 300 seconds, so half the exposure time of your dark frames. Also I always run my camera at -15C or -20C, and these were taken at -15C. You will still get good results at warmer temperatures, but I do all I can to mitigate thermal/dark noise. You can do a test to see how cold you camera can go, but always set the target temperature a few degrees above that so the temperature can easily be held constant.
As you have found, how you set the screen stretch makes a big differences as to how the dark frame looks. If you stretch the image enough then you will always see hot pixels, though when they are only slightly above the normal level it is better to think of them in terms of warm pixels. These warm pixels should not degrade your observations by much when you use dark frames to correct for them.
My first screenshot is of a medium screen stretch in MaximDL. This is an aggressive linear stretch with black at 1001.8 and white at 1223.9, so this really emphasizes the warm pixels. These pixels will have a minimal affect of the data quality as long as they are corrected by a dark frame.

I now switch to a linear stretch for the range of the camera with black at 0 and white at 65536. Now none of the warm pixels show up, but there are at least 4 hot pixels.

Finally, it is informative to look at a histogram of the CCD. Note the number of pixels is on a log scale, vertically up, with the intensity along the x-axis. So there are a handful of hot pixels above 10000 while a reasonable number from about 2000 to 10000. These warmer pixels will loose some dynamic range but after dark subtraction will still hold useful photon counts.

Cheers,
Andy
 Andy WilsonKeymaster
Hi Paul,
I was interested to see you post a link to this paper as I have spent the past couple of years working in the same office as Tom Wilson, with Tim supervising both of us.
I can’t claim to be an expert in his research but it is eye opening to discover how faint contaminant stars can affect astrometry.
Best wishes,
Andy6 September 2018 at 10:05 am in reply to: New RCB star in Cam – call for photometry/spectroscopy #579968 Andy WilsonKeymaster
I have added this star to the VSS database. Strictly speaking this isn’t necessary as any new stars created by uploading observations are automatically added to a list which I review once per quarter.
Measurements made by Maxim DL can be added to the database, though it is a bit manual. Richard Lee will be demonstrating how to analyse photometry using AIJ and the updated BAAVSS Photometry spreadsheet at the Observer’s Workshop on 29th September. This creates an output file that can simply be uploaded into the database. I will be demonstrating how to upload observations at the workshop, it is very easy.
Cheers,
Andy
 Andy WilsonKeymaster
The problem has been identified as 1st August being stated when viewing the email in plain text format, but 15th October showing correctly when viewing the email in html format. We have informed ERS so they can fix this in future emails.
Andy
 Andy WilsonKeymaster
Just to avoid any ambiguity, voting closes on Monday 15th October at 23:59 BST, though don’t delay your vote to the last minute 🙂
Nick, I will contact you privately to ask you to forward me the email you received. On the day voting officially opened, a few of us were sent voting emails in the morning so we could give everything one final check before the bulk emails were sent out. I just checked my email and it states Monday 15th October. It worries me that perhaps the bulk email to members contained the wrong date.
I am glad you found the email process straightforward. I echo your sentiments asking members to vote for the great selection of candidates we have this year.
Cheers,
Andy
 Andy WilsonKeymaster
Hi James,
The signal to noise ratio will be affected by both the number of photons, and how those photons are spread across the detector pixels (amongst other things). However, the SNR by itself is not everything, for example you also need to keep systematic errors to a minimum.
I think you already know this, but it is useful to state it anyway. Assuming a constant aperture, then the number of photons from a star will remain the same at different focal ratios. The focal ratio will then only affect the size of the star image and so how many pixels those photons will fall onto.
Taking an extreme case where the focal ratio is sufficiently short that the photons from an individual star fall onto a single pixel. In this scenario the signal from the star on that pixel will be at its maximum possible value and it will be as under sampled as it is possible to be. While this might sound good, it means you are relying on a single pixel to tell you everything about the star. While flat fields and dark frames remove the majority of pixel to pixel variations, then do not remove it all, and you will also get random noise. By spreading the photons from the star across several pixels you help to ‘smooth’ out this variation, and particularly any systematic differences from pixel to pixel. For example one technique to improve photometry is to defocus star images slightly so that the photons are spread across a larger number of pixels.
Hence for photometry, getting the sampling right should give you the best results. In some cases this might even mean oversampling (more pixels per star) though I have never tested this myself.
A couple of other point to consider:
- If you use comparison stars across a wide field of view then applying transformations to your measurements becomes more important as you are looking at stars passing through a different length of atmosphere.
- As you go fainter so there are more stars and so crowding of fields can become a problem. In this scenario you want a larger image scale so you can separate stars. Though of course you also need better seeing to do this properly.
This is not to say don’t go for a Hyperstar, but if you do then I would advise an imaging chip with small pixels so you don’t end up under sampling.
Cheers,
Andy
 Andy WilsonKeymaster
Hi John (and anyone else who is following this thread).
We have identified the problem. It was related to family membership where the first person to join the BAA is not the person who currently pays the subscription. We will be requesting a change to our systems to cope with this scenario. In the interim we can get around it for any affected members. I will be running a check later in the week to see if there are any other members who may be affected.
Kind regards,
Andy
 Andy WilsonKeymaster
Hi John,
First of all my apologies that you are experiencing problems with your renewal.
That is clearly not right. I am just starting some testing to try to identify the problem but please bear with me as I will only have intermittent access to the BAA systems for the next couple of days.
I can see one thing that might explain it to do with joint membership and a shared email address. The system should be able to cope with this, but I suspect it does not. I will email you about this separately so we can try out a few things without posting every detail on the forum.
Kind regards,
Andy Wilson
BAA Systems Administrator and Web Content Editor
 Andy WilsonKeymaster
Hi Ian,
I think you are part of a silent majority who have trouble setting up telescope mounts. It is good that you raise these points as I am sure there are others who will read this post having the same experience as you. Over the years I have comes across a good number of people with an interest in astronomy who bought a telescope but never successfully got it working and gave up.
I do think things are easier now than 10 or 20 years ago. To track stars you used to need an equatorial mount, but now there are many cheap computerized altazimuth mounts that will track and locate objects from a 2 or 3 star alignment. This does of course mean knowing how to locate the bright stars used for alignment, and this is where I know some people fall down. It is also true that you get what you pay for, but an easy to setup mount is often not the most expensive one.
While I am one of those who does some fairly advanced astronomy, I still remember learning about equatorial mounts and being confused. Each step has taken me time to learn and then master. I also enjoy casual astronomy where I just look at the Moon, the planets, or a deep sky object without going to the lengths of making a recorded observation. It is important to get the balance right, to ensure you enjoy astronomy and it does not become a burden.
Apologies if I am stating things you already know, but I would advise that you start simple. A low power eyepiece with a wide field of view, so that accurate mount setup is not as important. Though it is easy to find the Moon and planets without a goto mount, start off by using your mount to find those easy objects which you already know where they are. That way you will spot when something is wrong, and when it is working right. With fainter objects it can be difficult to know whether your telescope is pointing at the wrong bit of sky, or if the object is too faint for your telescope and sky conditions.
If you still have your telescope(s), then you could try posting specific questions on the mount you use. There may be others on the forum who know that mount and can offer advice. Otherwise someone may be able to post advice on relatively cheap, easy to use mountings from their personal experience.
Best wishes,
Andy
 Andy WilsonKeymaster
Great spectrum capture Michael with a good number of lines identified! And with the added bonus of the Pleiades in the image background 🙂
Andy
 Andy WilsonKeymaster
Hi Jack,
Sorry to hear you are having problems with your Lhires III. Do you mean light loss from the spectrograph, or light leakage into the spectrograph from outside?
Will you be coming to the Observers’ Workshop – Variable Stars, Photometry and Spectroscopy on 29th September? That is a good place to start as there may be other Lhires users present. I can try to find out if you are interested. I would not rule out an Lhires III weekend, but we would need enough interest to make it work, and people willing to organise it. Also a weekend event has much bigger costs due to the need for overnight accommodation.
Cheers,
Andy
 Andy WilsonKeymaster
Hi Steve,
I hear what you are saying, as you should not need to introduce a washer to get a good image. It will be interesting to hear how Kevin gets on.
I am a bit biaised as I started off with the cheaper L200 (by JTW) before upgrading to the Lhires III at about twice the price. These are both Littrow spectrographs with some similar design features. The quality of the guide image I was seeing through my Lhires, while not perfect, was far superior to my L200.
Example L200 guide image with obvious flaring and triple image of the star.

Example Lhires III guide image. Not perfect with a secondary image of the star, but overall better image quality.

To put this in context for anyone following this thread, in spectroscopy the purpose of the guide image is to allow you to locate your target star, position it on the slit and to keep it there. So while a good quality makes this job easier it is not strictly speaking essential. The Lhires III and L200 have a series of mirrors and lenses to relay and focus the guide image to a camera, and these can introduce various image aberrations. For example I was able to get some excellent spectra out of my L200 even though the guide image was not very good.
Cheers,
Andy
 Andy WilsonKeymaster
Hi Steve,
I found that my Lhires III worked out of the box, other than initial setup like focusing and finding the micrometer setting to view the H-alpha line. It is a more complex instrument than an Alpy, so there are more things to adjust and it may not be the best place to start out in spectroscopy.
I managed to get some decent results on my first night, helped by the fact that I had previously been using an L200 which has a lot of similarities with the Lhires III. I did see improvement from my first observations to later ones as I tweaked the setup and learned how to get the most out of the spectrograph. It is a continual journey, and I am sure in a few years I will be getting even better results.
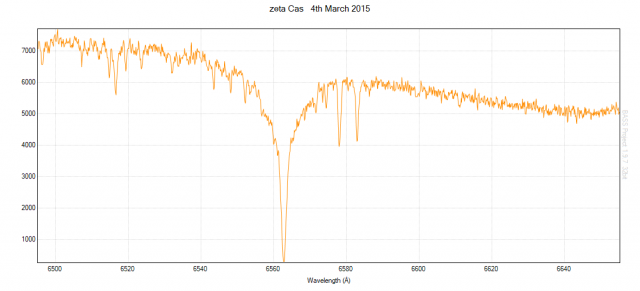
To show you what I mean, below are some observations from my first light with my Lhires III. First a spectrum profile of zeta Cas.

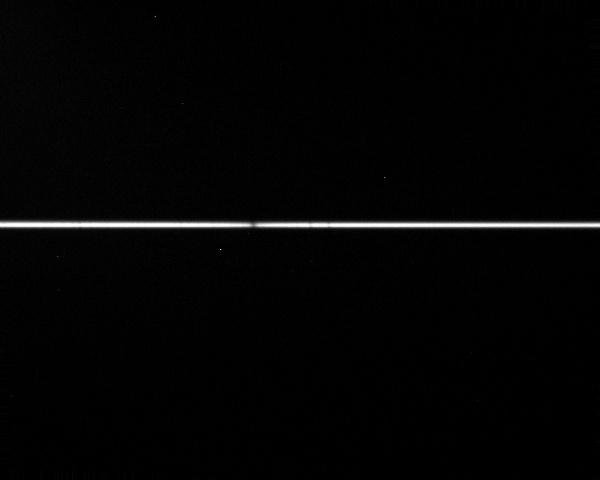
Here is one of the spectrum images.

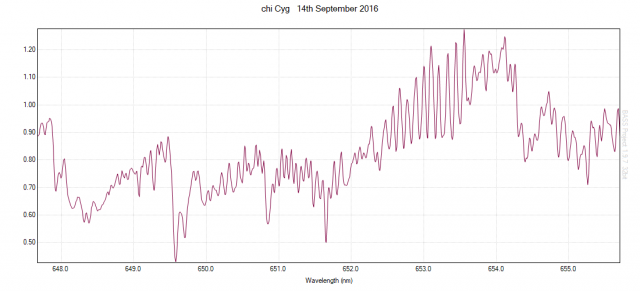
Then about 18 months later here is a spectrum of chi Cyg.

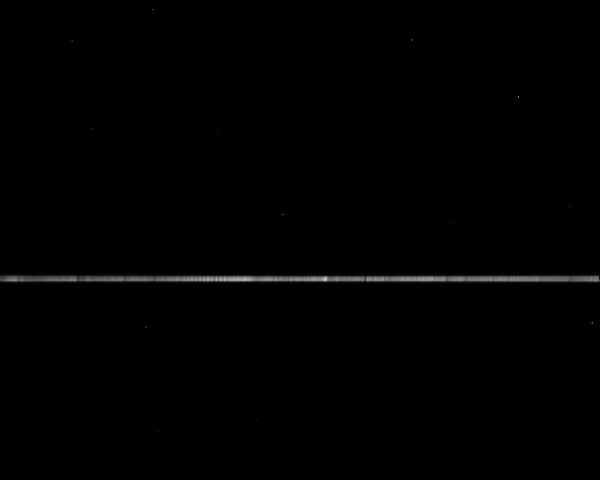
And the underlying combined spectrum images.

Cheers,
Andy
 Andy WilsonKeymaster
Hi Kevin,
Good to hear you are making progress in the right direction.
I misunderstood the way you were moving the spectrum. I too experimented with moving the mirror, though this was 2-3 years ago and I cannot remember all the details. I think I originally saw an improvement in the appearance / reduced height of the spectrum with the mirror at one extreme. I later realised I was getting less flux and so I think I was cutting off some of the light, or missing some of the light in that position.
I will be at the Observers Workshop in September.
Cheers,
Andy
 Andy WilsonKeymaster
I think Robin has covered a lot of stuff really well. I will add a few more thoughts from my experience, taking Robin’s lead by replying to all of the points in one post.
Reply to #8
>(i) The spectrum gets wider (more height in Y-axis) as it goes down the sensor
>(ii) As well as this, the overall integrated flux gets bigger – an increase of around 50% from the two extremes explored here.
>(iii) However, the spectrum is not so good in the larger-flux
I wonder if these are all related. As I understand it you are moving the spectrum down the slit, taking a series of images. I am not sure you would expect the same quality of spectrum near the top of the slit, in the middle, and at the bottom of the slit. I suspect, but could be wrong, that the narrow vertical height of the spectrum might be due to some of the light being cut off by either missing the mirror or otherwise not following a path that successfully reaches the sensor. Hence, you see more flux with a wider height, which does not look as good, because this is how the spectrum naturally looks when all the light successfully passes through the spectrograph. I remember looking at this with my Lhires III. I also experimented with different mirror positions and at first thought great I am getting a nice tight spectrum. Only later did I look at the throughput and then realise I was getting less photons.
If you can get a nice spectrum in narrow vertical height with the same signal, then that is of course ideal. However, a spectrum spread in height of 10 or even 20 pixels is not necessarily a major problem. The geometric corrections should sort out the spectrum lines so they are nice and vertical, so you won’t loose much in resolution when the signal from different rows is combined. Also spreading the signal over a few pixels can be a good thing as then you have not got the problem of a single bad pixel or cosmic ray hit ruining a region of the spectrum.
Another way to investigate how the throughput changes with vertical position of the star on the slit is to take a sky spectrum at twilight, or possibly even daytime. It is like a flat, though not a flat you could use as it will be the solar spectrum. For this type of investigation the flat lamp may not be as good as it may not illuminate the slit evenly. The idea is by looking at the change in intensity with height, it will give you an idea of where to position your star for maximum throughput. Remembering the stellar spectrum does have vertical height, so this is not perfect, but it will give you a good feel for where maximum light passing through the slit to reach the CCD. Of course you can do this by positioning the star at different positions on the slit, but this gives a quick way to look at the whole slit.
On another topic related topic. I always try to position the star at about the same position in vertical height on the spectrograph CCD, as this minimises differences between spectra. Even though a flat field should remove most variations, I do everything I can to make create a repeatable accurate spectrum. When carrying out response or flux calibration, this means the light from both the reference and target stars following the same path through the spectrograph, and illuminate the same CCD pixels.
Grating Holder
I found the grating holding was pinching my grating a little too tightly, and this was distorting the grating and so the spectrum. I loosed the holder, and then re-tightened it so the grating was held firmly in place. I saw a noticeable improvement in my spectrum, but it still had a vertical height of 10-20 pixels.
Cheers,
Andy
 Andy WilsonKeymaster
Hi Kevin,
I will reply to your points ii and iv, and perhaps a bit on i, as I think they may be related. I have the same setup as you, an LHIRES III and a GSO 10″ RC.
When I first started with my LHIRES III, I concentrated on trying to get perfect guide stars and a perfectly narrow spectrum. I was getting some very nice results. Then after a few months I tried tweaking things to get the maximum throughput. I found I was getting my best results by going for a compromise setup. By that I mean that the spectrum is not perfectly narrow, and neither is the guide image perfect. It is possibly I gave up too early, but from conversations with Shelyak and other users, I think the sweet spot is genuinely a compromise setup.
My main learning was not to concentrate on getting the narrowest possible spectrum. I realised this when I started using MaximDL to examine spectra on the fly. Not looking to maximise the counts in the centre of the spectrum, or trying to get the narrowest possible spectrum, but instead to get the largest combined counts across the height of the spectrum. Hopefully you understand what I mean, which is basically you want as many photons to pass through the slit and spectrograph, reaching the detector. I found this might not be when the star appears perfectly focused on the slit, or the spectrum image as narrow as possible. This seemed a bit crazy at the time, and maybe I am still missing something, but I kind of assume it is something to do with the slit being a half-silvered glass plate. It is worth noting I don’t mean a horrible guide image or spectrum, just not absolutely perfect.
Here are a couple of images to try to illustrate what I mean. First an image of the spectrum of gamma Peg at high spectral resolution.

You can see the image is not perfectly focused as the central obstruction shows in the middle. However, if I examine the vertical profile using a box area in MaximDL I see the following.

So the dark centre is far from being black, but contains a lot of signal. I tried various ways to improve the look of the spectrum, to make it look more ‘Gaussian’ in cross-section and I did achieve this. However, when I did thorough checking of the results, I was always getting less photons.
So when I focus, I aim to maximise the cross-sectional area of the spectrum, not the star on the slit. Just to be clear these are small changes, so the stars still look reasonable in the guide camera. To use this method of focusing (this is focusing the telescope), you need a star that is bright enough to give a decent spectrum in 10-20 seconds but not so bright that the spectrum starts to saturate. With shorter exposures you will be chasing seeing affects rather than true focus, and longer exposures will take a long time to try out different focus positions to reach the sweet spot.
I find there is very little image shift in the GSO 10″ RC unless the temperature really varies a lot during the night. So I can spend a decent time getting good focus, and then often leave it for weeks.
With regard to the guide image, here is an example from my setup for comparison.

I hope some of this helps. It would be interesting to hear if other LHIRES III users found similar results to me, or get their best results with the narrowest spectrum.
Cheers,
Andy
 Andy WilsonKeymaster
Anyone switching to a digital subscription needs to let the BAA Office know in advance of their renewal. We might be able to add this functionality to web based renewals one day, but there is a lot that needs to happen behind the scenes to make that possible.
Of course e-voting is available to all members, digital and non-digital, as long as we hold an up to date email address.
Andy
-
AuthorPosts
